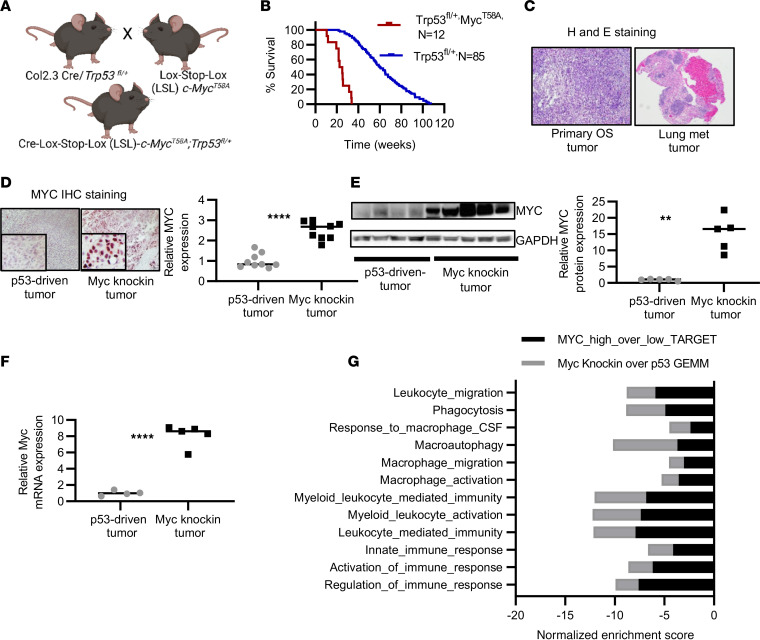
Figure 1. Development and proteotranscriptomic characterization of Myc-knockin GEMM of OS.
(A) Schema of generation of Myc-knockin GEMM. (B) Kaplan-Meier curve showing accelerated OS development in the Myc-knockin (n = 12; red) versus heterozygous Trp53fl/+ (n = 85; blue) model; log-rank (Mantel-Cox) test was performed for the Kaplan-Meier analyses. (C) H&E of the primary tumor (left panel) and associated lung lesions (right panel). Original magnification, 4×. (D) IHC staining with MYC in the paraffin-embedded tumor tissue samples showed higher expression in the Myc-knockin specimen compared with p53-driven GEMM tumor; quantified expression is shown in the right panel. IHC images were captured at 20× original magnification. Inset image is original magnification, 80×. (E) Western blot demonstrating increased MYC protein expression in Myc-knockin tumors compared with Trp53fl/+ driven tumor; quantified expression is shown in the right panel. (F) Relative mRNA expression analyzed by the RNA sequencing (RNA-Seq) demonstrated increased Myc mRNA expression in Myc-knockin (n = 5) tumors compared with the p53-driven (n = 4) tumor sample. (G) Gene set enrichment analysis (GSEA) comparison between GEMM tumor tissue samples and the high-Myc- versus low-Myc-expressing human OS model using the OS TARGET data set. **P < 0.01, ****P < 0.0001.

