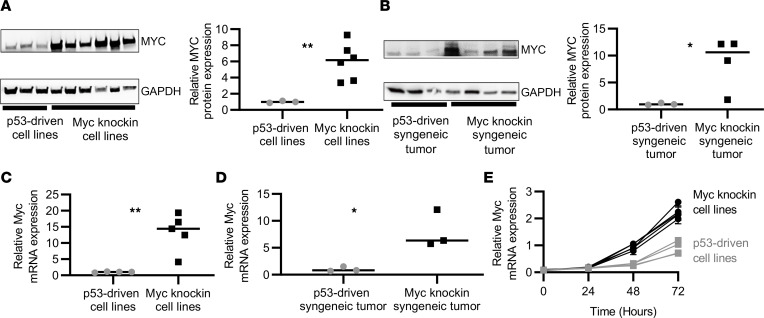
Figure 2. Proteotranscriptomic characterization of OS syngeneic mouse models and cell lines.
(A) Western blot demonstrating increased MYC protein expression in Myc-knockin cell lines compared with p53-driven cell lines; quantified expression is shown in the right panel. (B) Western blot demonstrating increased MYC protein expression in Myc-knockin syngeneic mouse tumor tissue compared with p53-driven samples; quantified expression is shown in the right panel. (C) Quantitative PCR (qPCR) demonstrating increased Myc mRNA expression in Myc-knockin (n = 4) cell lines as compared with Trp53fl/+ (n = 4) tumor cell lines. (D) qPCR demonstrating increased Myc mRNA expression in Myc-knockin syngeneic mouse (n = 4) compared with Trp53fl/+ (n = 4) mouse. (E) Myc-knockin and p53-driven cell proliferation (the lighter line is for low-Myc cell lines and darker lines for high-Myc cell lines). (*P < 0.05,**P < 0.01.)

