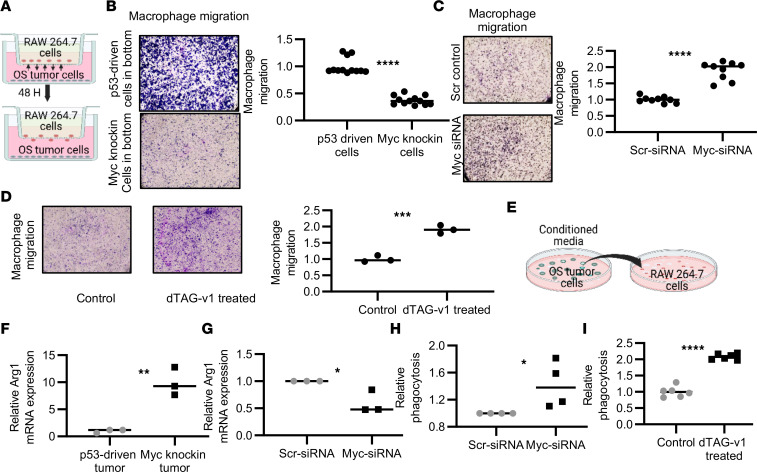
Figure 6. MYC mitigates intratumor macrophage cell infiltration and phenotypic function.
(A) Schematic diagram showing the coculture setup. A total of 100,000 OS tumor cells were seeded on the bottom chamber, and 50,000 RAW 264.7 cells were seeded on the upper chamber and allowed to migrate for 48 hours. (B) Transwell migration of RAW 264.7 cells toward the Myc-knockin cell lines (upper panel) compared with the p53-driven cell line (lower panel); quantified RAW 264.7 cell migration is shown in the graph. (C) Migration of RAW 264.7 cells in the Myc-knockin cell line after siMyc (lower panel) as compared with the Scr control–treated (upper panel) OS cells; quantified RAW 264.7 cell migration is shown in the graph. (D) Migration of RAW 264.7 cells after dTAG-v1 treatment (right panel) compared with control (left panel) in the F331-dTAG-Myc cell line; quantified RAW 264.7 cell migration is shown in graph. (E) Schematic diagram showing the effect of cell culture supernatant on the RAW 264.7 cell polarization. (F) Expression of Arg1 (M2 macrophage marker) in the RAW 264.7 cells cultured in the supernatant collected from the Myc-knockin cell lines (n = 3) as compared with p53-driven (n = 3) samples. (G) Expression of Arg1 in RAW 264.7 cells cultured in the conditioned media after siMyc knockdown (n = 3). (H and I) Macrophage phagocytosis after siMyc and after MYC protein degradation (dTAG-v1). (*P < 0.05, **P < 0.01, ***P < 0.001, ****P < 0.0001.)

