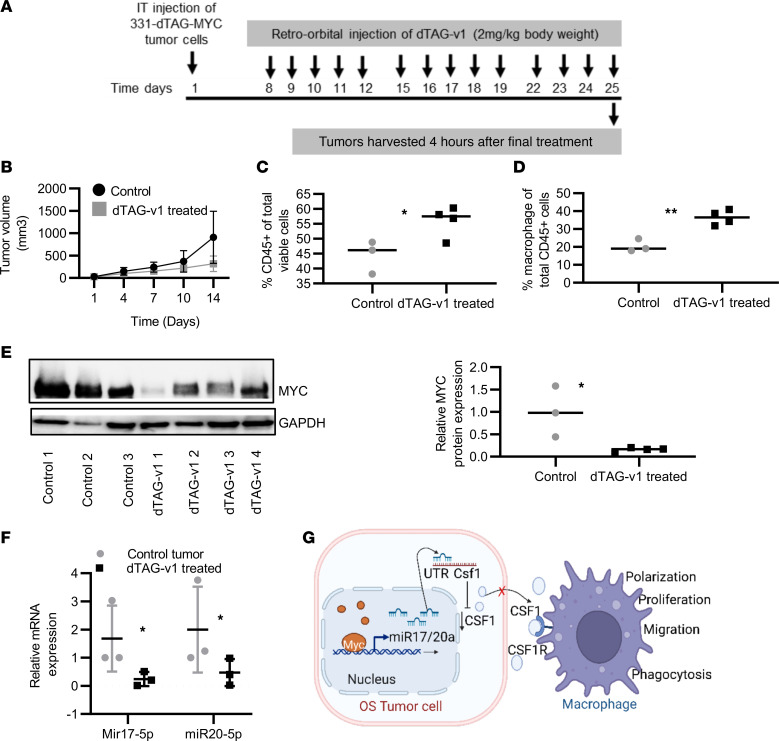
Figure 7. Selective in vivo pharmacological degradation of MYC protein levels and its effects on the OS immune landscape.
(A) Schematic diagram showing the tumor cell injection and dTAG-v1 drug treatment. (B) Tumor volume after 2 weeks of control (n = 3) and dTAG-v1 treatment (n = 4). (C) Analysis of intratumor FACS analysis for CD45 population after control (n = 3) and dTAG-v1 treatment (n = 4). (D) Macrophage population analysis after 2 weeks of dTAG-v1 treatment. (E) Western blot analysis for MYC expression after 2 weeks of the dTAG-v1 treatment. Blot quantification data are shown in right panel. (F) Expression of miR-17/20a after control and dTAG-v1 treatment (n = 3/cohort). (G) Schematic diagram showing the MYC-dependent regulation in the TME of OS. (*P < 0.05, **P < 0.01.)

