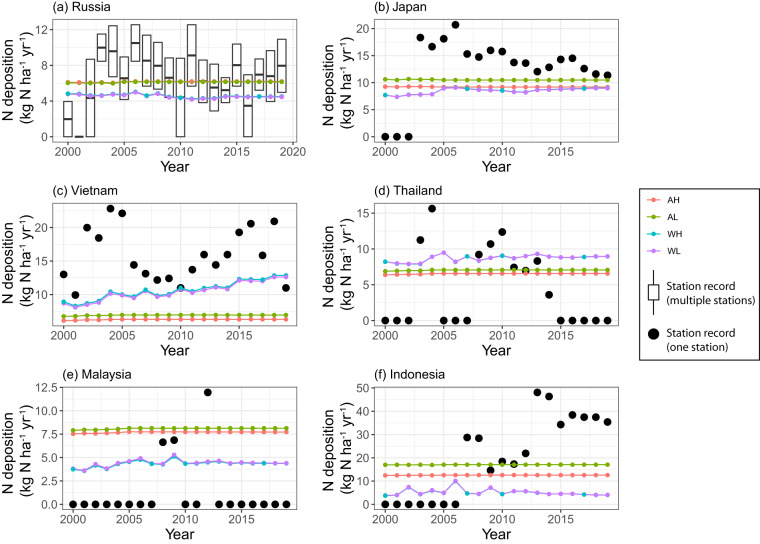
Fig. 9.
Comparison of station measurement from EANET station-network with the N deposition maps aggregation. Each colored dot represents estimate for each year from different deposition and cropland maps. The black dot here indicates data from station network. Boxplot represents distribution of N deposition (dry + wet) from stations considered for comparison. The acronyms in legends are AH: ACCMIP + HYDE; AL: ACCMIP + LUH2; WH: Wang et al. + HYDE; and WL: Wang et al. + LUH2. Note: Except for Russia, which has two sites in rural area, the remaining countries have only one site in rural area. .

