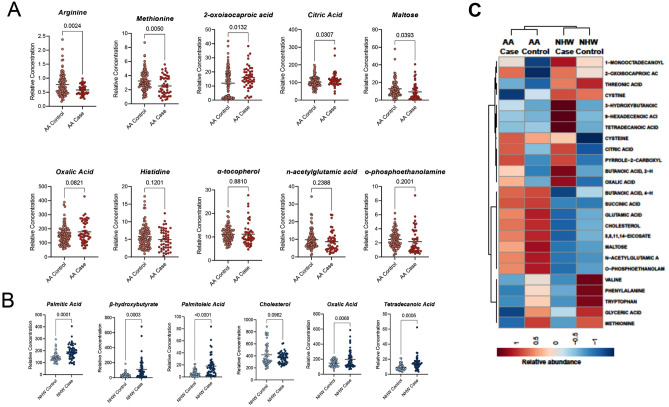
Figure 3.
(A) Boxplot of the relative concentration of 10 differential metabolites in AA individuals divided by cancer cases and healthy controls. (B) Boxplot of the relative concentration of six differential metabolites in NHW individuals divided by cancer cases and healthy controls. The relative contribution of each feature towards the accuracy of predicting cancer cases is reported as mean Gini (A,B). The percentage of importance or relative influence that each feature contributes to the model are shown in the figure. (C) Heatmap showing metabolite levels in AA cases vs controls and NHW cases vs controls.

