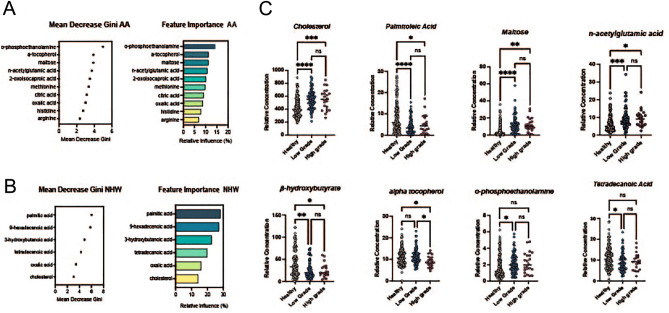
Figure 4.
(A) Feature importance ranking with Mean Decrease Gini index calculated by the Random Forest (RF) algorithm for AA. The top features selected are shown. (B) Feature importance ranking with Mean Decrease Gini index calculated by the Random Forest (RF) algorithm for NHW The top features selected are shown. (C) Boxplot of relative concentration of 8 differential metabolites in cohort divided by healthy controls, low tumor grade and high tumor grade.

