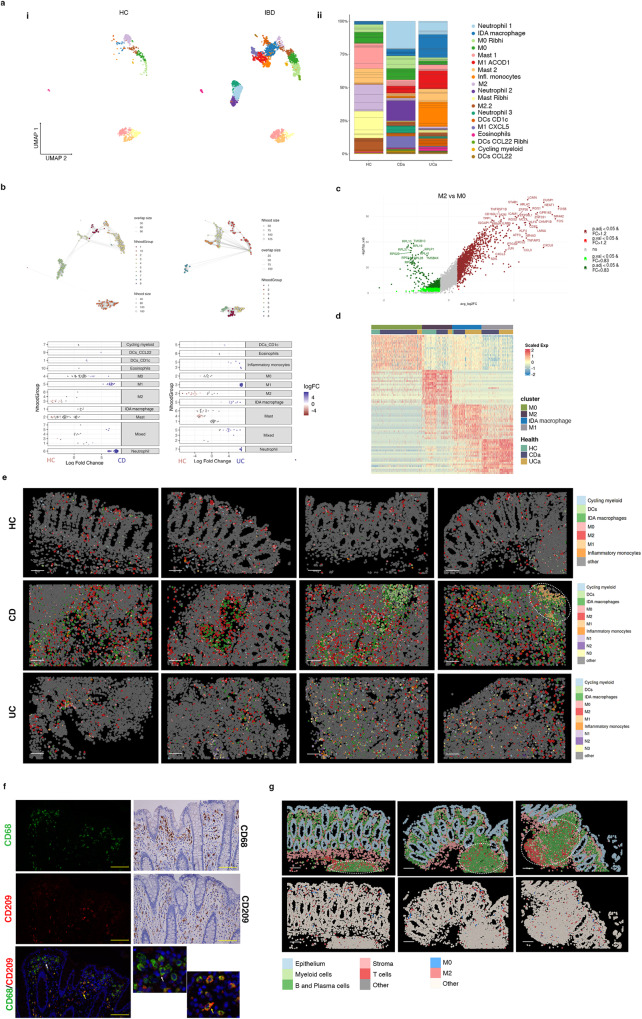
Fig. 2. Analysis of myeloid cell subsets in healthy and inflamed colonic mucosa.
a UMAP representation of scRNA-seq data for the myeloid clusters in healthy controls (HC, n = 6) and IBD colonic samples (CD n = 6, UC n = 6) (i); myeloid cell subset proportions across healthy and IBD samples (ii). b Cell type enrichment analysis using the differential abundance test Milo comparing CD (left panels) or UC (right panels) to HC. Nhood groups are shown for each comparison (top panels). The fold changes and annotations of each nhood in CD and UC samples are shown in lower panels. c Volcano plot of differentially expressed genes (DEGs) comparing M2 to M0 macrophages (see Supplementary Table 2 for the complete gene list). A two-sided Wilcoxon rank sum test was applied. Genes with a false discovery rate adjusted p value < 0.05, and a fold change (FC) > 1.2 or FC < 0.83 are considered regulated. d Heatmap showing average expression of DEGs for M0, M2, M1 and IDA macrophages in HC, CD and UC. e CosMxTM SMI images showing spatial distribution of the different myeloid cell populations in representative Fields of View of colonic tissue of two HC, one CD and two UC patients. White dotted circle indicates ulcerated area with abundant M1 macrophages. Scale bar = 100 μm. f Double immunofluorescence showing M2 (CD209+CD68+) and M0 (CD209-CD68+) cells in one healthy tissue (left and lower right insets). White and yellow arrows indicate M0 and M2 macrophages, respectively. Right two top panels: immunohistochemistry showing CD68 and CD209 expression in one healthy tissue. Images are representative of 12 independent samples. Scale bar = 20 µm. g CosMxTM SMI images of a representative healthy colonic sample with lymphoid follicles (highlighted by dotted circles). The cellular localization of epithelial, stroma, T cells, B and plasma cells, and myeloid cells,(top panels) and M0 and M2 macrophages (lower panels) is shown. Scale bar = 100 μm. Source data are provided as a Source Data file. HC, healthy controls. IBD, inflammatory bowel disease. CD, Crohn’s disease. UC, ulcerative colitis.

