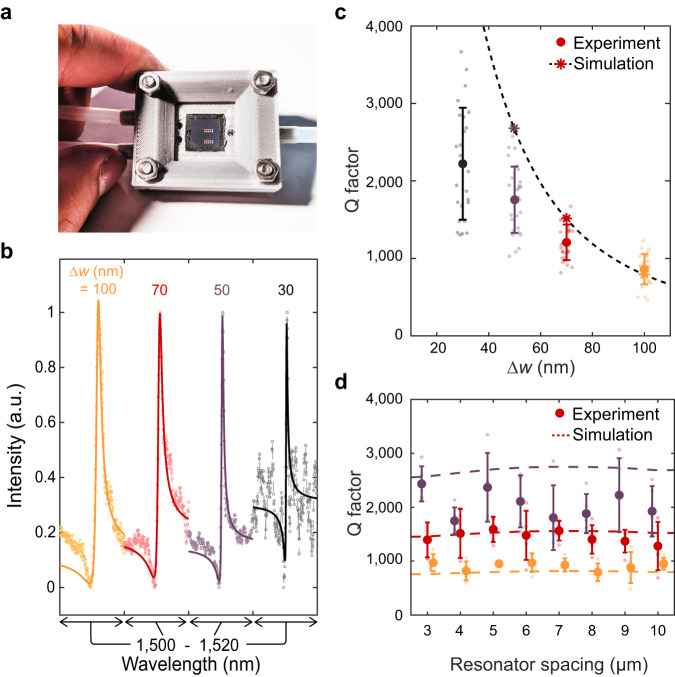
Fig. 2. Fluid cell characterization of metasurfaces.
a Photo of metasurface chip enclosed in fluid cell. b Representative spectra from resonators with varying Δw. Solid lines represent fits to a Lorentzian oscillator. c Quality factor of resonances with different Δw. Bold markers and error bars are the mean and standard deviation for N = 30 resonators at each condition. Stars represent simulated values and the dashed line is a fit to predicted values from coupled mode theory (Supplementary Note 3). d Quality factor as a function of resonator spacing where mean and standard deviation are for N = 5 resonators at each condition.

