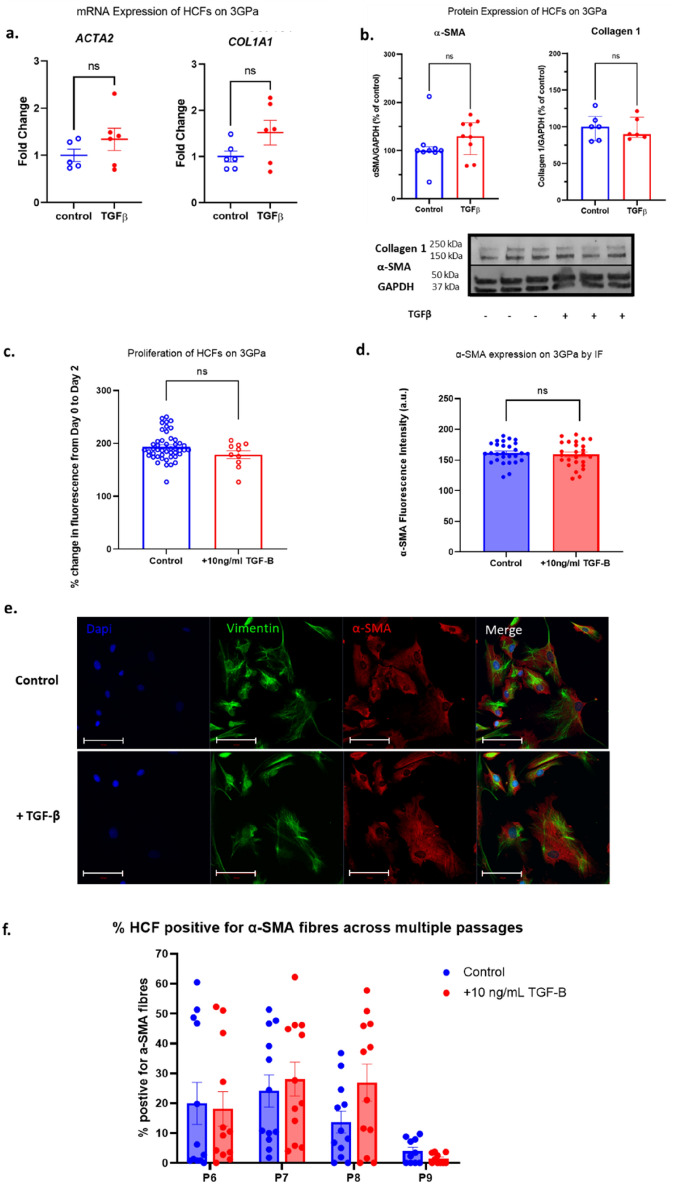
Figure 2.
Activation status and proliferation of human cardiac fibroblasts on 3 GPa culture plates. Cells were grown in the presence and absence of 10 ng/ml TGF-β. (a) Activation of HCF as measured by RT-PCR for ACTA2 and COL1A1. (b) Activation status of HCF measured by western blotting for α-SMA and collagen 1 protein. (c) Proliferation over 48 h was evaluated as a percentage change from baseline (day 0) in fluorescence by CyQUANT assay. (d) Quantification of α-SMA protein expression by immunofluorescence. (e) Representative immunofluorescence images for figure (d). Scale bar = 100 µm. (f) percentage of HCF positive for α-SMA fibrous staining at P6-9 followed by exposure to 10 ng/mL TGF-β for 2 days. Data presented as mean ± S.E.M. N = 5 (a), 6–9 (b); 4 plates, 6 + wells per plate (c), 3 experiments, 3 images per condition (d), 6 wells, 2 images per well, percentage cells per image (f). t test (a,b) and nested one-way ANOVA (c,d) compared with undrugged control. Significance was defined by p < 0.05.

