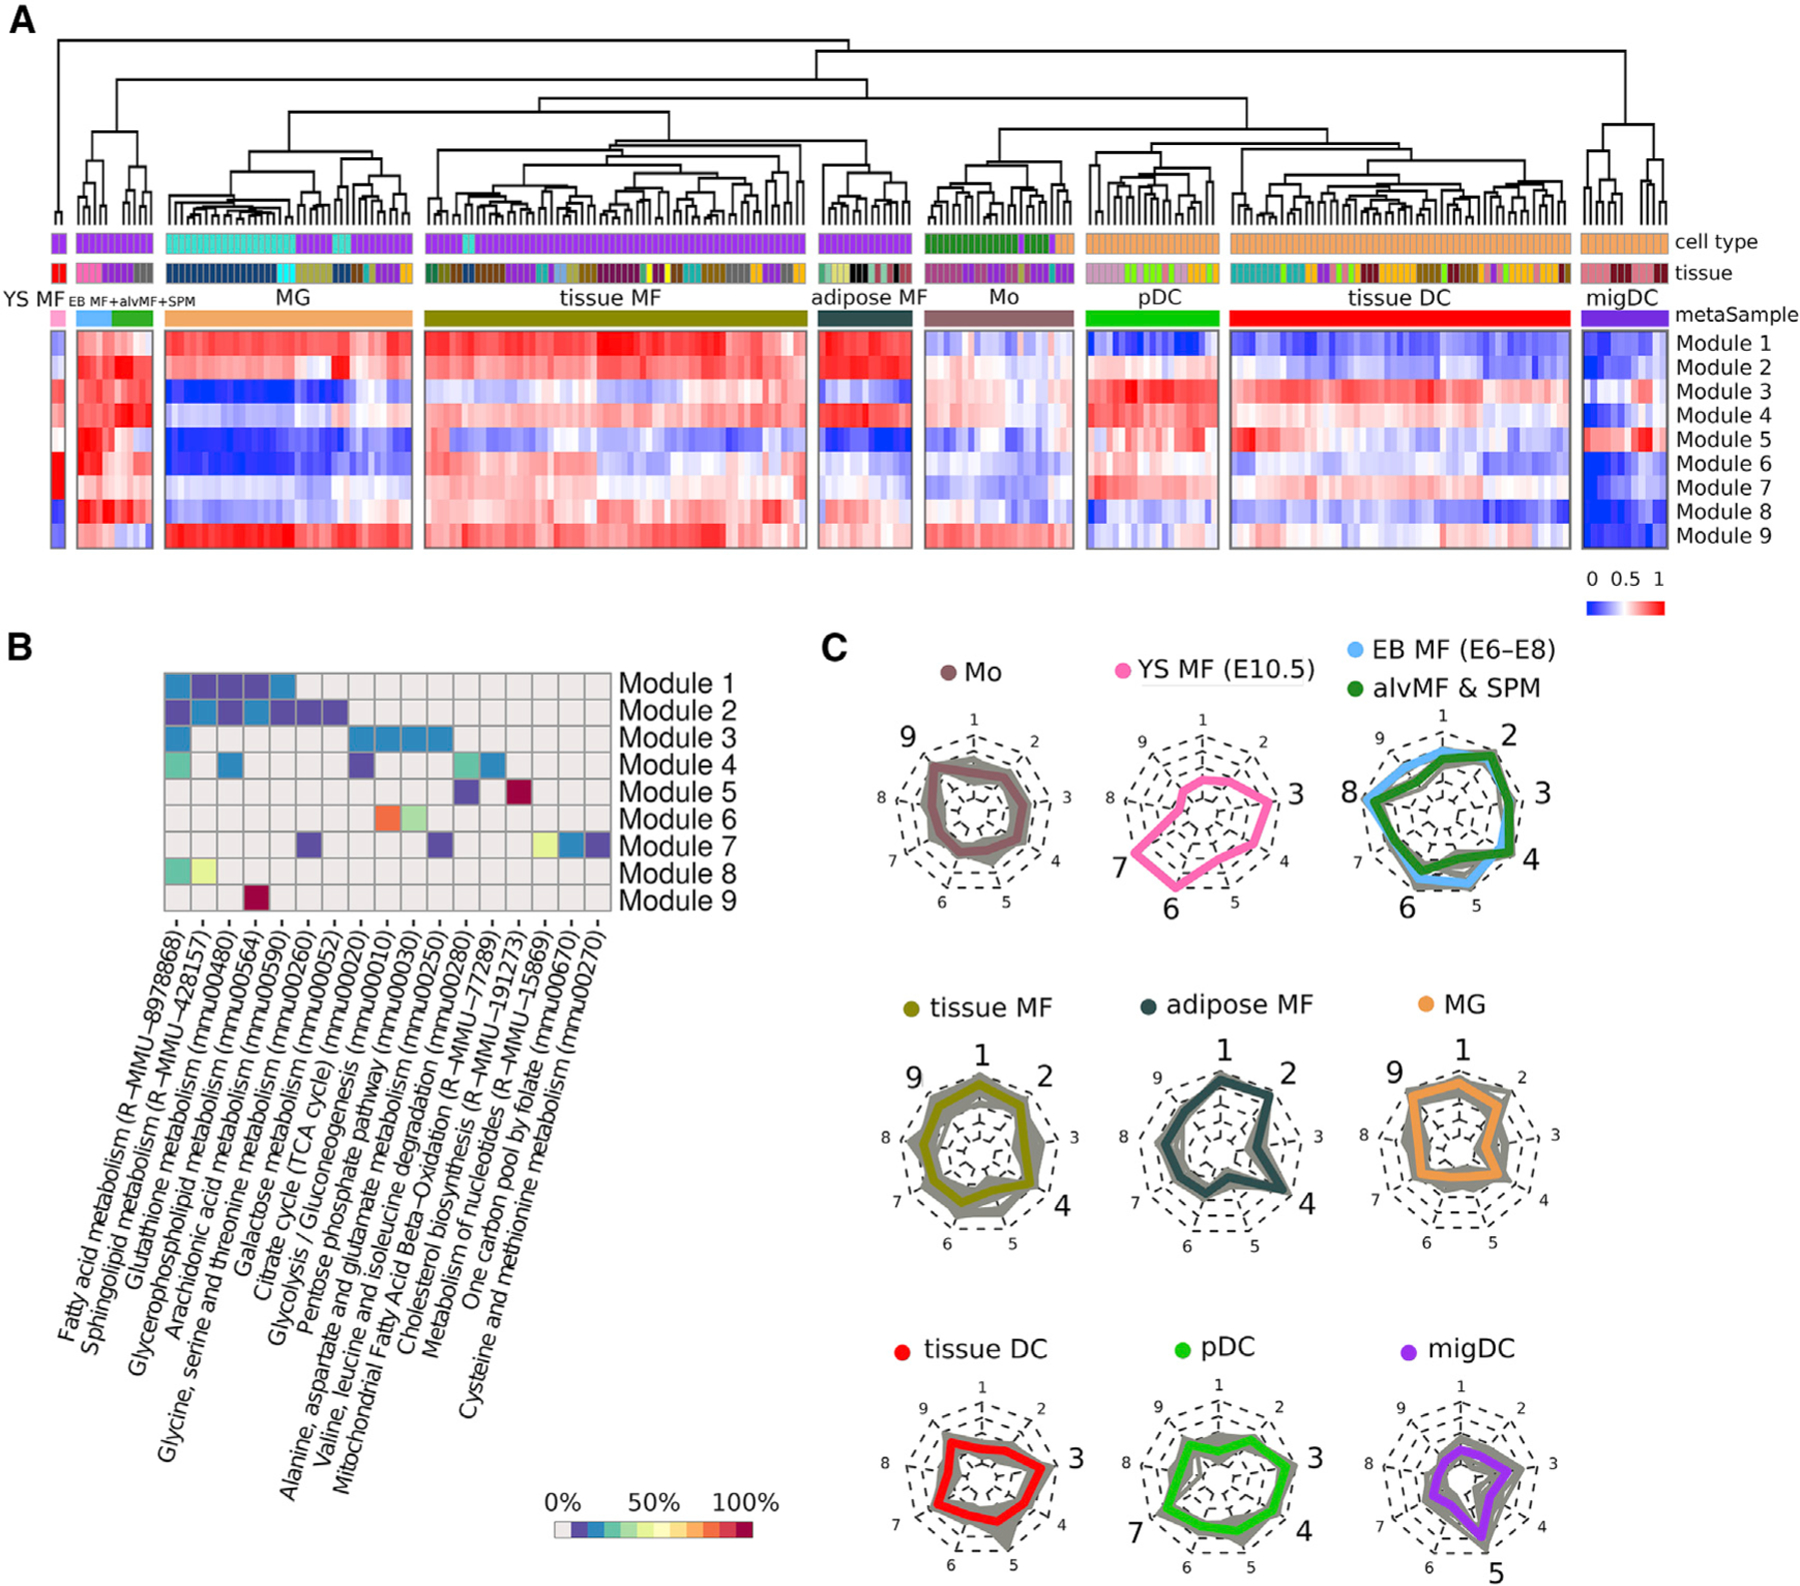
Figure 4. Metabolic modules as a result of multi-sample metabolic network clustering of all myeloid cells but not inflammatory conditions from ImmGen MNP OS dataset.

(A) Heatmap representing samples hierarchically clustered based on averaged gene expression of each of obtained module (from lowest as blue to highest as red). Euclidean distance is used as a clustering metric. YS MF, yolk sac macrophage; EB MF, embryoid body macrophage; alvMF, alveolar macrophage; SPM, small peritoneal macrophage; MG, microglia; MF, macrophage; Mo, monocyte; DC, dendritic cell; pDC, plasmacytoid DC; migDC, migratory DC.
(B) Annotation of the obtained modules based on gene enrichment in KEGG and Reactome canonical pathways. Enrichment value is calculated as a percentage of module genes contained in a particular pathway.
(C) Radar chart representation of metabolic modules within each metasample. Each individual sample is shown as a gray line, while mean of all samples inside one metasample is shown as a colored line. Nine radii of the radar chart are devoted to the corresponding metabolic modules: 1 and 2: lipid metabolism; 3: FAS pathway; 4: mtFASII pathway; 5: cholesterol synthesis; 6: glycolysis; 7: folate, serine, and nucleotide metabolism; 8: FAO and sphingolipid de novo synthesis; and 9: glycerophospholipid metabolism. Metasamples of EB MFs + alvMFs and alvMFs + SPM cells are shown at one chart as they are extremely close in their metabolic characteristics.
