
Figure 1.
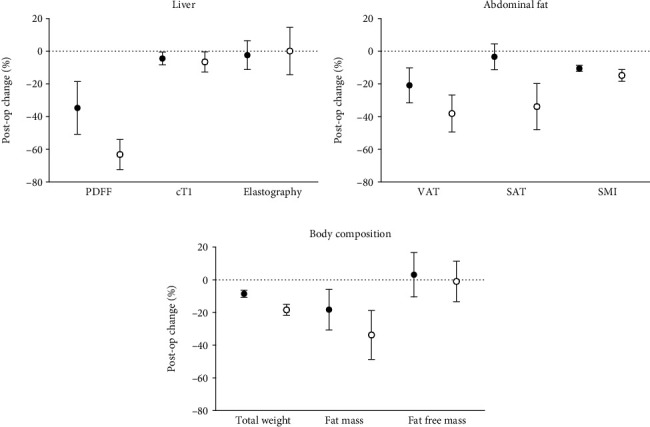
Percentage decrease in (a) liver MRI and MRE, (b) abdominal fat, and (c) body composition at the immediate postsurgery (black circle: •) and later postsurgery period (open circle: ○) compared to baseline. VAT: visceral adipose tissue; SAT: subcutaneous adipose tissue; SMI: skeletal muscle index; PDFF: proton density fat fraction; cT1: iron-corrected T1; postop: postoperative. Data presented as the average percentage decrease and 95% confidence interval.