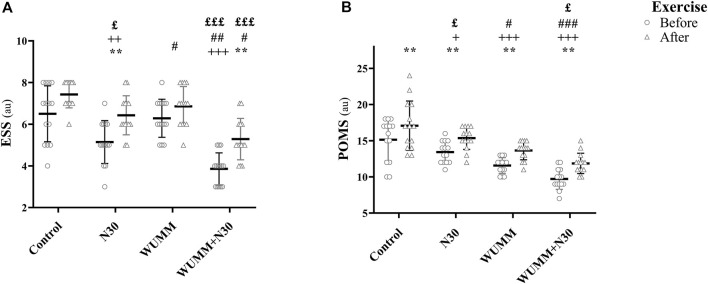
FIGURE 3.
The Profile of Mood State (POMS) and Epworth Sleepiness Scale (ESS) before and after exercise during the protocol sessions. N30: 30-min nap; WUMM: warm-up with self-selected motivational music; WUMM + N30: combination of N30 with WUMM. *, **, ***: significant difference with before exercise at p < 0.05, p < 0.01, p < 0.001, respectively; +, ++, +++: significant difference in comparison with Control at p < 0.05, p < 0.01,p < 0.001, respectively; #, ##, ###: significant difference in comparison with N30 at p < 0.05, p < 0.01, p < 0.001, respectively; £, ££, £££: significant difference in comparison with WUMM at p < 0.05, p < 0.01, p < 0.001, respectively.

