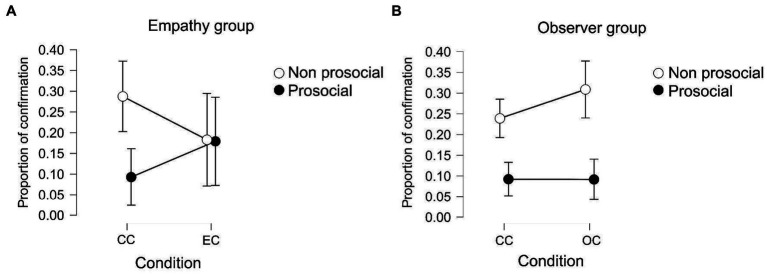
Figure 4.
(A) Proportion in which participants of the empathy group confirm their original choice. The white dots represent the choice that participants took in the first place, in white non-prosocial and in black prosocial. (B) Proportion in which participants of the observer group confirm their original choice.

