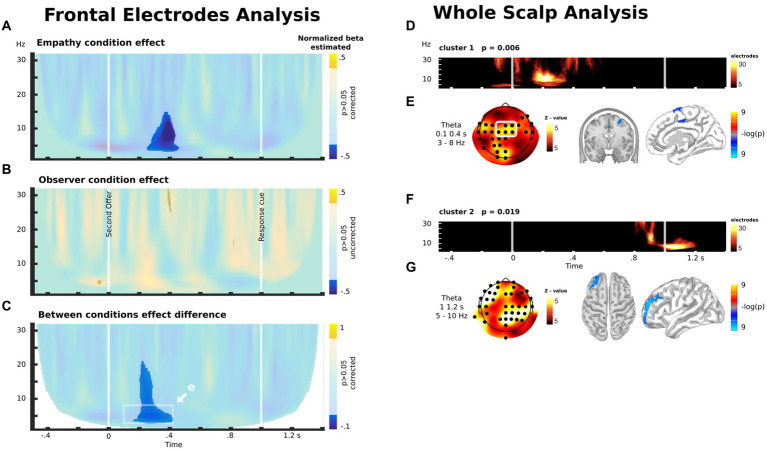
Figure 5.
(A) Difference between the control and empathy conditions in the correlation between oscillatory brain activity in the frontocentral electrode (white rectangle in E) and the unequal distribution to the other player during the decision time. (B) Difference between the control and observer conditions in the correlation between the oscillatory brain activity in the frontocentral electrode (white rectangle in E) and the unequal distribution to the other player during the decision time. (C) Between-group comparison of the difference between the control and experimental conditions in the correlation between the oscillatory brain activity in the frontocentral electrode (white rectangle in E) and the unequal distribution to the other player during the decision time. (D) Significant cluster emerging by means of exploratory whole-scalp analysis for the contrast shown in C. (E) Scalp distribution of the theta modulation in the time-frequency windows highlighted in C and its source estimation. (F) Another significant cluster emerging by means of exploratory whole-scalp analysis for the contrast shown in C. (G) Scalp distribution of the theta modulation of the cluster shown in F and its source estimation. (D,F) The color scale represents the number of electrodes with significant activity within each time-frequency bin, as part of the cluster.

