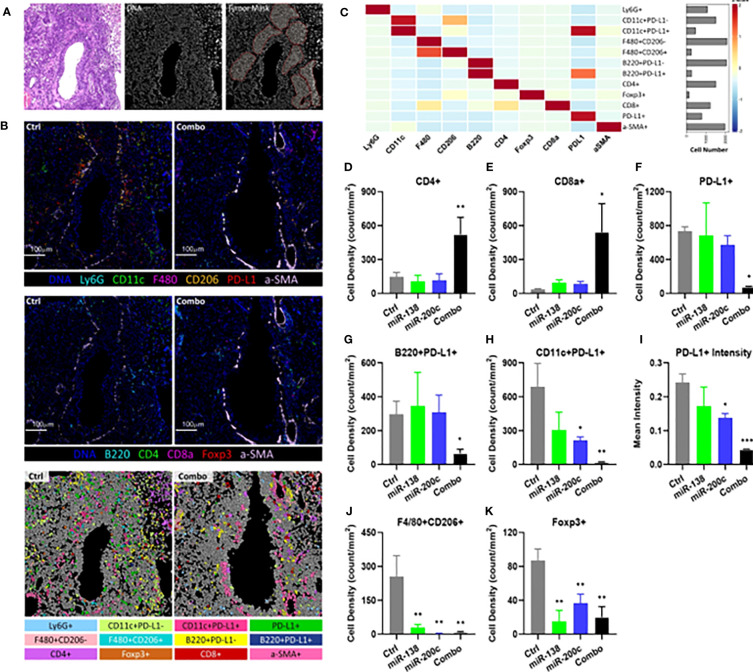
Figure 4.
Characterization and spatial distribution of the immunological landscape in mouse SCC tumor samples using imaging mass cytometry. (A) Representative H&E stain (left), DNA channel (middle) and tumor mask (right) of the control sample. Scale bar=100μm. (B) Representative DNA, CD11c, Ly6G, F4/80, CD206, PD-L1, and αSMA (top); representative DNA, CD4, FoxP3, CD8a, B220, and αSMA images of tumors from control and combo-treated mice (middle), and cell phenotypes mapping of tumor from control and combo-treated mice (bottom). (C) Heatmap showing the expression of 10 lineage markers within 12 identified cell types. The heatmap was z-score transformed by column to emphasize marker expression by clusters. (D) Cellular densities comparisons of CD4+ T cells. (E) Cellular densities comparisons of CD8+ T cells. (F) Cellular densities comparisons of PD-L1+ cells. (G) B220+PD-L1+ cells (PD-L1+ B cells). (H) CD11c+ PD-L1+ cells (PD-L1+ DCs). (I) Quantification of PD-L1 intensities in TIME. (J) Cellular densities comparisons of F4/80+CD206+ (Type 2 macrophage). (K) Cellular densities comparisons of FoxP3+ cells (Tregs). For all samples, cellular densities were averaged across 4-6 images per sample from each group. The number of cells was identified per mm2 stained tumor area as the cellular densities. Significance was analyzed by unpaired two-tailed student t-test, *P< 0.05, **P< 0.01, ***P< 0.001 vs control.

