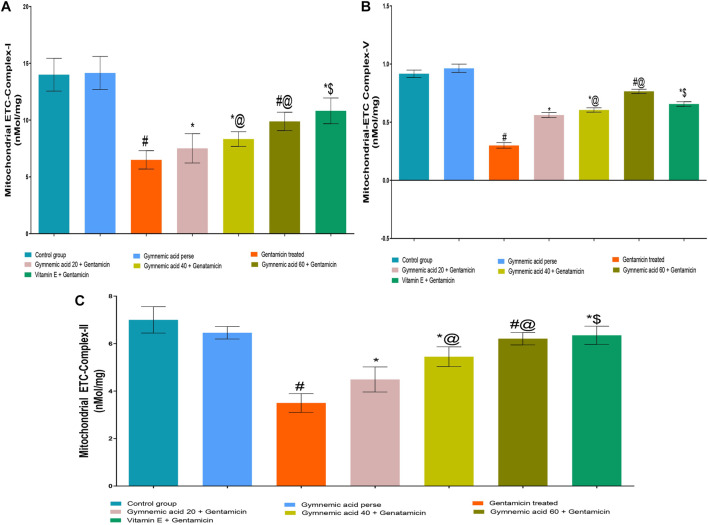
FIGURE 5.
(A–C) Effect of GA on mitochondrial-ETC complex-I (A); mitochondrial-ETC complex-V (B); and mitochondrial-ETC complex-II (C) enzyme level ingentamicin-treated nephrotoxic rats. Data representing seven Groups per group of six rats in the above graph. Values were expressed as mean ± SD; Tukey’s multiple comparison tests analyzed data. # p < 0.001 versus vehicle control/GA 60; *p < 0.001 versus gentamicin treated; *@ p < 0.001 versus gentamicin and GA 20; #@p < 0.001 versus gentamicin and GA 40; *$ p < 0.001 versus gentamicin and GA 60.

