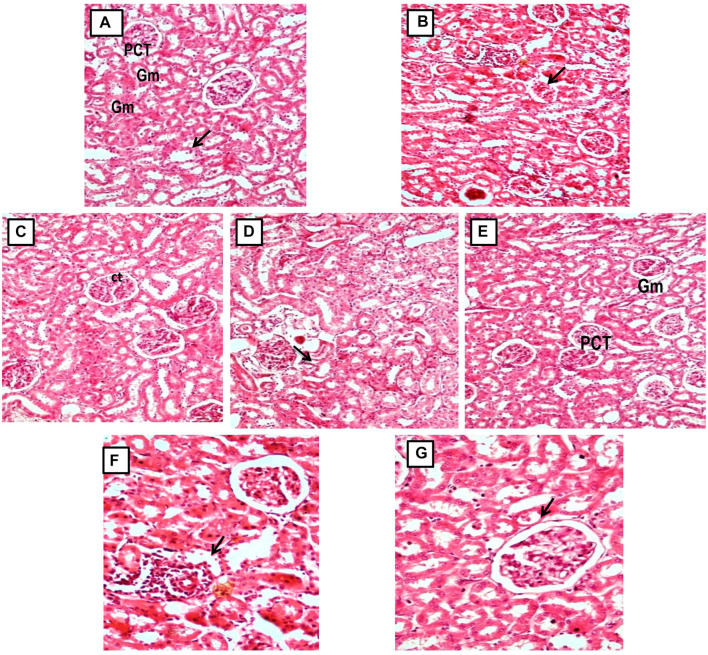
FIGURE 9.
(A, C) Micrograph of group 1 and 3, Normal and GA 60 mg/kg Kidney group demonstrating normal histological structure of glomerulus (Gm) and renal tubules (PCT: Proximal convoluted tubules and CT: Collecting tubules); (B) Microscope image of kidney of gentamicin-treated group 2 demonstrating focal necrotic area with severe infiltration of lymphocytes (arrow) and shrunken glomeruli (Gentamicin 100 mg/kg, i.p; (D, E) Microscopy of Kidney from GA pretreated group 4 and 5 demonstrating restoration of degenerative changes in renal tubules (gentamicin 100 mg/kg, i.p. + GA 20 and 40 mg/kg); (E, F) Micrograph of group 6 and 7 showing reduction of kidney Tubular necrosis, glomerular mesangial hypercellularity, focal haemorrhage, and chronic inflammation (gentamicin 100 mg/kg, i.p. + GA 60 mg/kg and gentamicin 100 mg/kg, i.p. + Vitamin E 8 mg/kg).

