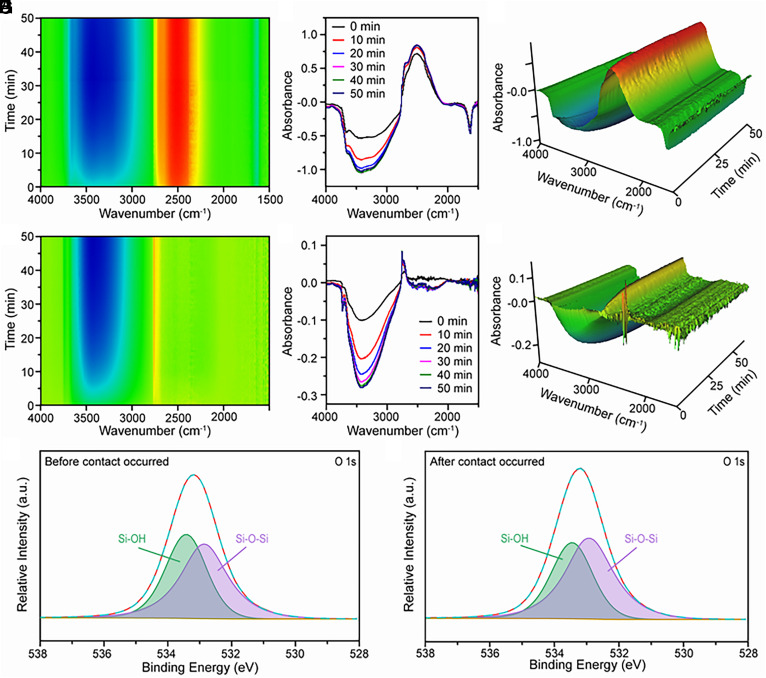
Fig. 3.
FT-IR and XPS spectra of surface OH groups when contact occurred between SiO2 nanoparticles and D2O. (A) A typical 2D time-resolved FT-IR spectrum captured at the initial stage of the contact that occurred between D2O vapor and commercial SiO2. (B) The corresponding FT-IR spectrum in A. (C) The corresponding 3D time-resolved FT-IR spectrum in A. (D) A typical 2D time-resolved FT-IR spectrum during the contact that occurred between D2O vapor and SiO2 with hydroxyl groups after the exchange of hydrogen with deuterium. (E) The corresponding FT-IR spectrum in D. (F) The corresponding 3D time-resolved FT-IR spectrum in D. (G) The O 1S XPS spectra of SiO2 before the contact occurred. (H) The corresponding O 1S XPS spectra after the contact occurred.

