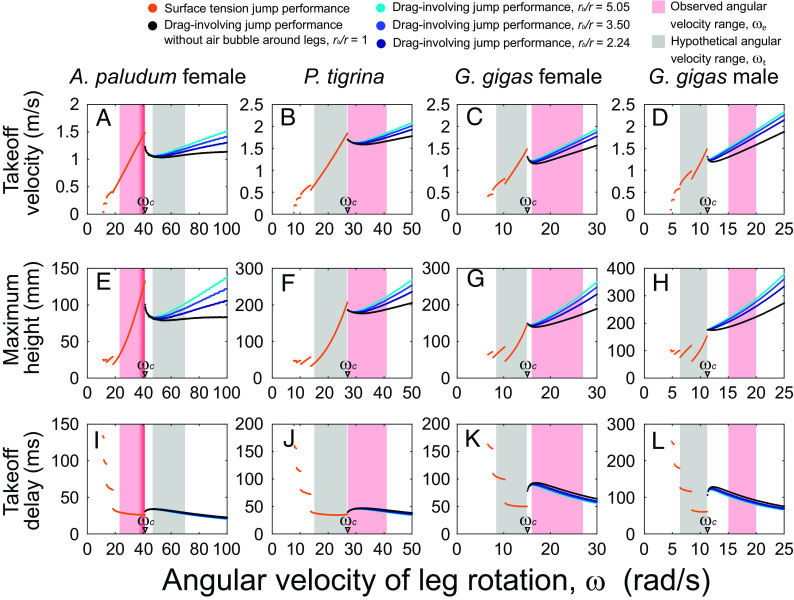
Fig. 5.
Theoretically predicted jump performance as a function of midleg angular velocity for four classes of water striders’ body size based on A. paludum females, P. tigrinaG. gigas females, and G. gigas males when E = 10 GPa. Jump performance measured by three variables calculated by the model: takeoff velocity (A–D), maximum jump height (E–H), takeoff delay (I–L). Average empirical values (mass, leg length for each leg section, leg radius, initial height of the body) for each body size class were used to simulate the jumps for each body size class across a wide range of angular velocity of leg rotation (x axis). Orange dots represent surface tension jumps, and other dots represent drag-involving jumps. The radius ratio of 5.05, 3.5, 2.24, and 1 (i.e., no bubble situation) are represented as light blue, blue, dark blue, and black dots, respectively. The red-shaded vertical bars represent the ranges of the observed leg angular velocity values ( ). For smaller species, known to be able to precisely adjust their leg angular velocity in order to perform just under the threshold line (19, 22), a narrow band is additionally marked with darker shade for the range of values that represent jumps in this optimal situation. The gray-shaded vertical bars represent the range of the hypothetical leg angular velocity ( ) for A. paludum using drag in their jumps, and for the other large species using surface tension jumps. The angular velocity of leg rotation, , values were determined from slow motion jumping videos as explained in the SI Appendix, Supplementary Materials PART 14 and shown in SI Appendix, Table S9. The performance of drag-involving jumps was calculated for three sizes of air bubble surrounding the leg: minimal, maximal, and average. Similar figures for Young’s modulus of 5 and 15 GPa are shown in SI Appendix, Figs. S24 and S25.

