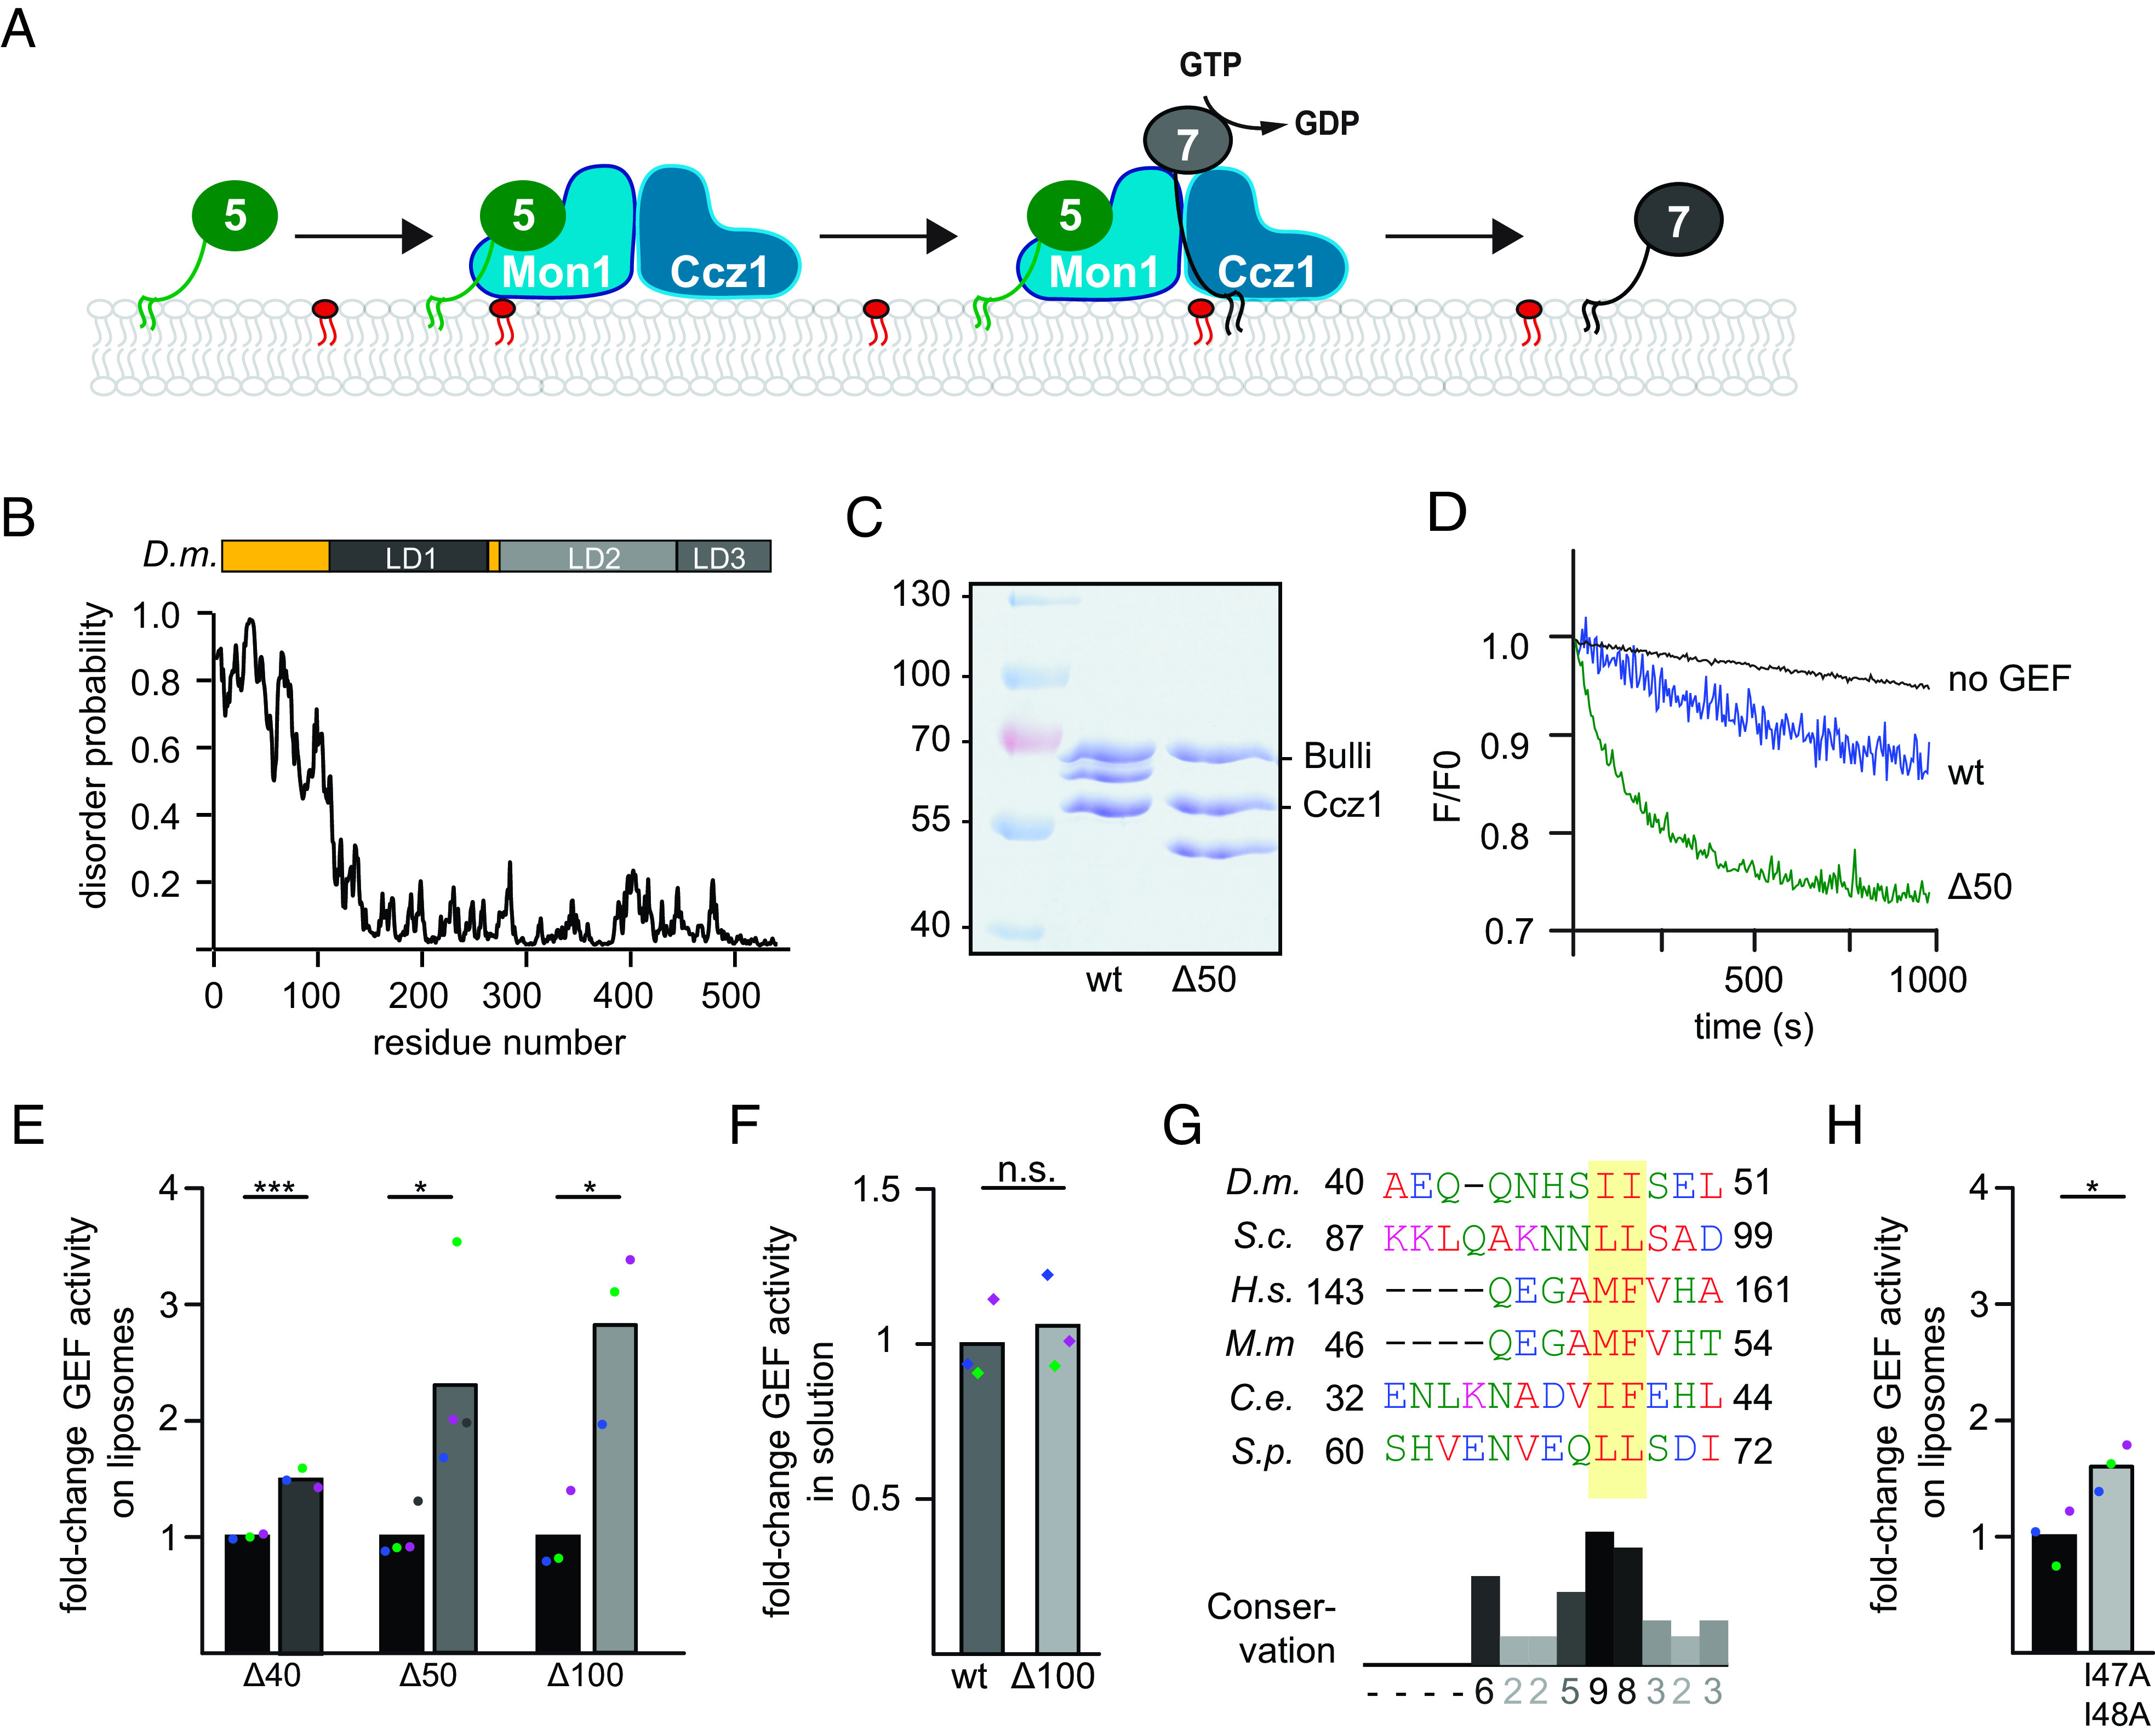
Fig. 1.

The disordered N-terminal region of Drosophila Mon1 regulates Mon1–Ccz1 GEF activity. (A) Overview of the Rab5-Rab7 cascade on endosomes. Active Rab5 (green) recruits the Mon1–Ccz1 GEF complex (blue) to PI3P-positive (red) endosomal membranes and promotes Rab7 (gray) recruitment and activation. For details, see text. (B) The N-terminal region of D.m. Mon1 is disordered. The disorder probability of each residue of D.m. Mon1 was determined using the IUPred2A web interface (24, 25). Longin domains (LDs) 1 to 3 are depicted in gray shades. Values >0.5 are considered disordered. (C) Truncation of Mon1 does not affect the complex stability of the trimeric Mon1Δ1-50–Ccz1–Bulli complex (∆50) compared to wild-type complex (wt). GEF complexes were purified as described in the Materials and Methods section and analyzed by SDS-PAGE and Coomassie staining. (D) On liposome GEF assay of Mon1wt and Mon1Δ1-50 containing trimer. Liposomes were preloaded with 150 nM prenylated Rab5 in the presence of 200 µM GTP and 1.5 mM Ethylenediaminetetraacetic acid (EDTA). The nucleotide was stabilized using 3 mM MgCl2. 250 nM Mant-GDP-loaded Rab7:GDI was added, and nucleotide exchange was triggered by adding 6.25 nM wild-type (blue) or mutant (green) GEF complex. The decrease in fluorescence was measured over time and normalized to fluorescence prior to GEF addition. (E) Comparison of fold-change in GEF activity of various Mon1 truncations. GEF assays were performed as in D, and kobs of each curve was determined as described in the Materials and Methods section. kobs values of mutants were normalized to the corresponding wild-type value in the respective experiment. Bar graphs represent average fold-change to the respective wild-type value, and dots represent individual changes from at least three experiments. (P value: *P < 0.05 and **P < 0.01, using a two-sample Student’s t test assuming equal variances). For kinetic constants of all GEF complexes, see SI Appendix, Table S3. (F) GEF activity of wild type and Mon1Δ1-100 containing trimer in solution. 2 µM nonprenylated Rab was incubated with increasing amounts of GEF. After baseline stabilization, nucleotide release was triggered by adding 0.1 mM GTP final. For details of data fitting and statistics, see the Materials and Methods section. The kcat/KM (M−1s−1) value for Mon1Δ1-100 containing trimer was normalized to the value of Mon1wt. Bar graphs represent average fold-change, and dots represent individual changes from three experiments. (P value: n.s. using a two-sample Student’s t test assuming equal variances). (G) Multiple sequence alignment of a hydrophobic patch in Mon1. The N-terminal regions of Mon1 from Drosophila melanogaster (D.m.), Saccharomyces cerevisiae (S.c.), Homo sapiens (H.s.), Mus musculus (M.m.), Caenorhabditis elegans (C.e.), and Schizosaccharomyces pombe (S.p.) were aligned using th Clustal omega web interface (26, 27). The hydrophobic patch is marked by a yellow box. Conservation was determined using Jalview (28). (H) Comparison of fold-change in GEF activity of Mon1I47, 48A. GEF assays were performed as in D, and kobs of each curve was determined as described in the Materials and Methods section. kobs values of mutants were normalized to the corresponding wild-type value in the respective experiment. Bar graphs represent average fold-change to the respective wild-type value, and dots represent individual changes from three experiments (P value: *P < 0.05, using a two-sample Student’s t test assuming equal variances). For kinetic constants of all GEF complexes, see SI Appendix, Table S3.
