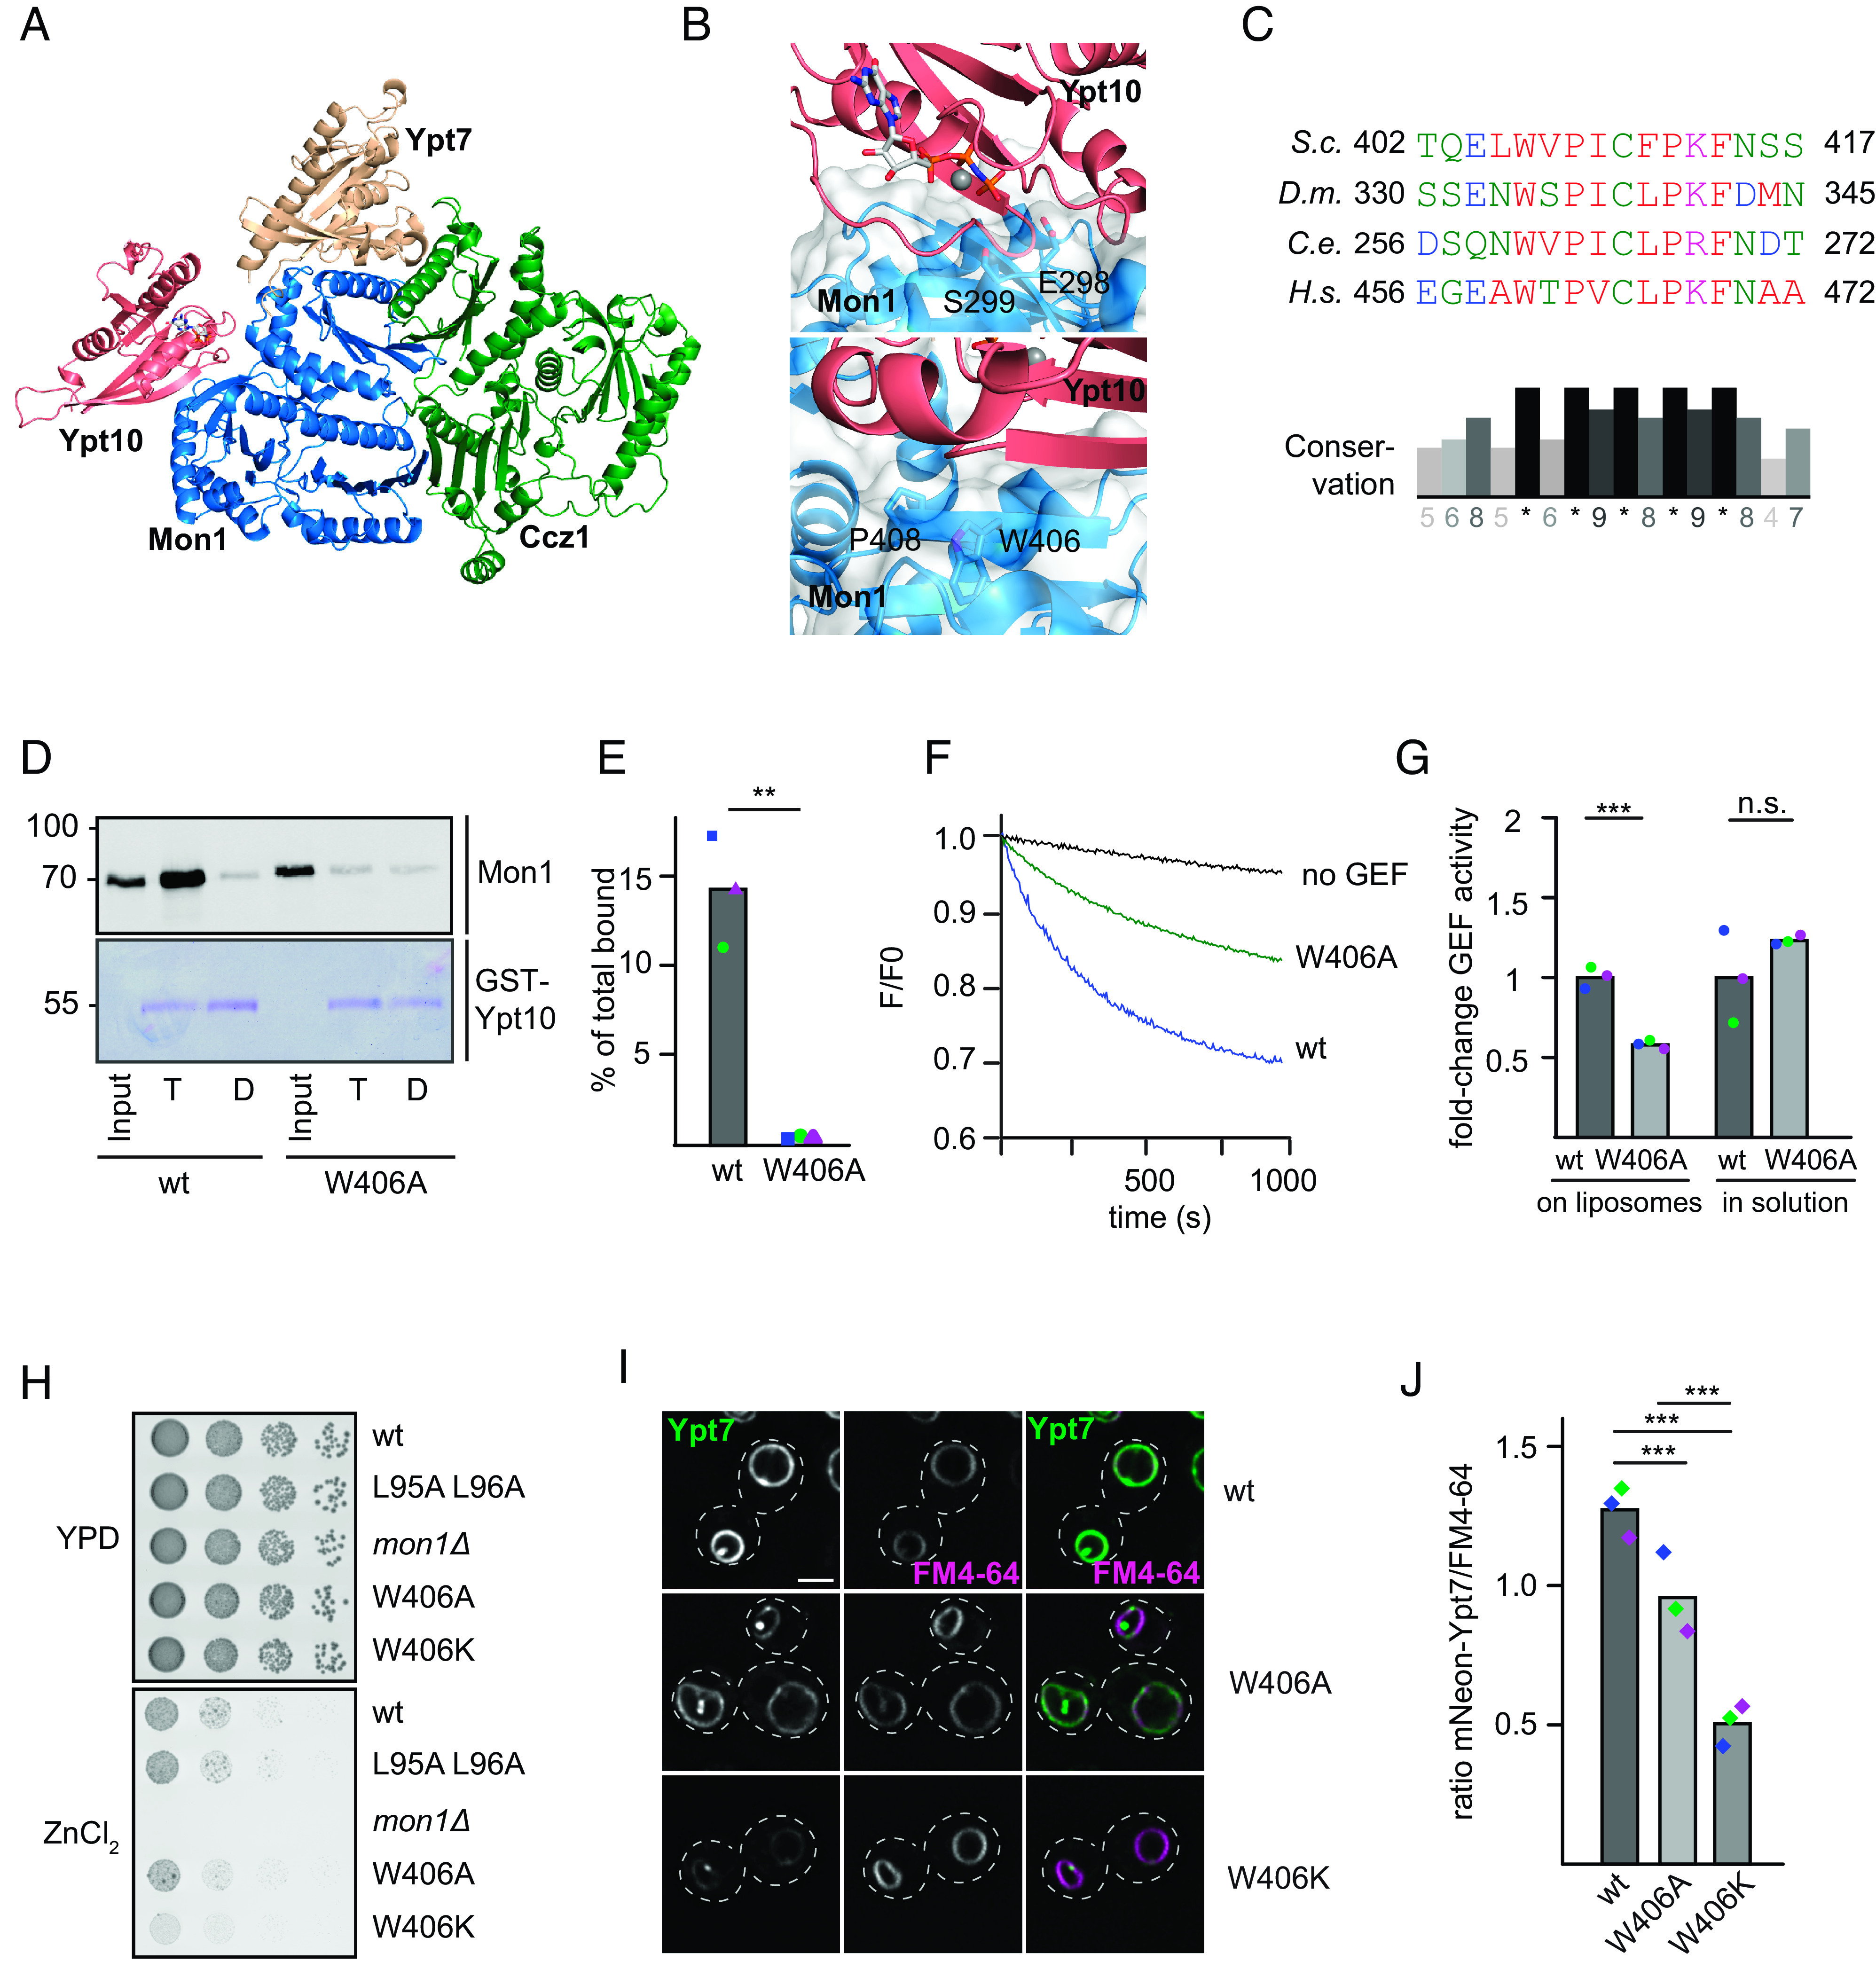
Fig. 3.

Identification of the Rab5-binding site in the Mon1–Ccz1 complex. (A) Identification of the putative Rab5-binding site in Mon1. Composite model of the S.c. Mon1 (blue)-Ccz1 (green)-Ypt7 (beige)-Ypt10 (pink) complex based on an Alphafold 2 prediction (31, 32) and the crystal structure of the catalytic core complex (PDB ID: 5LDD) (19, 32, 33). (B) Close-up view of the Mon1–Ypt10 binding interface. Colors are as in A. (C) Multiple sequence alignment of Mon1 β-strand in the modeled Rab5 binding region. Mon1 sequences from S.c., D.m., Caenorhabditis elegans (C.e.), and Homo sapiens (H.s.) were aligned using the Clustal omega web interface. Conservation was determined using Jalview. (D) Effect of the Mon1W406A mutant on Rab5 binding. 75 µg purified GST-Ypt10 was loaded with GTP (T) or GDP (D) and incubated with 25 µg of either wild-type or Mon1W406A GEF complex. Elution of bound GEF was performed with EDTA. 20% of the eluate was analyzed together with 1% input by western blotting using an anti-Mon1 antibody. 2% GST-Ypt10 was stained with Coomassie as loading control (E) Quantification of bound GEF complex to Ypt10-GTP. The band intensity of Mon1 signal in elution fraction was measured using Fiji software and compared to input signal. (P value **< 0.01 using a two-sample Student’s t test assuming equal variances). (F) Effect of the Mon1W406 mutation on Rab5-dependent GEF activity. 250 nM Mant-GDP-loaded Ypt7:GDI was added, and Rab activation was measured by the fluorescence decrease over time. Liposomes were loaded with 150 nM prenylated Ypt10 using 200 µM GTP and 1.5 mM EDTA. The nucleotide was stabilized using 3 mM MgCl2. The reaction was triggered by adding 25 nM GEF complex. The decrease in fluorescence was normalized to fluorescence prior to GEF addition. (G) Comparison of fold-change in GEF activity of Mon1W406A to Mon1wt complex on liposomes and in solution. For details of in solution GEF assay, see Materials and Methods. For GEF assay on liposomes, kobs of each curve was determined as described in the Materials and Methods section. kobs values of mutant were normalized to the wild-type GEF complex value. For in solution assays, kcat/Km values were normalized to the wild-type value. Bar graphs represent average fold-change, and dots represent individual values from three experiments. (P value ***< 0.001, using a two-sample Student’s t test assuming equal variances). (H) Growth assay. Indicated Mon1 variants in a mon1 deletion background were grown to the same OD600 in YPD media and then spotted in serial dilutions onto agar plates containing YPD or YPD supplemented with 4 mM ZnCl2. Plates were incubated for several days at 30 °C. (I) Localization of Ypt7 in wild-type and mutant strains. Plasmids encoding Mon1wt, Mon1W406A, or Mon1W406K variants were expressed under their endogenous promoter in a mon1 deletion strain. Vacuoles were stained with FM4-64. Images were deconvolved (SOftWoRx software 5.5). Size bar, 2 µm. (J) Quantification of the ratio between FM4-64 and mNeon-Ypt7 mean intensity signal on the vacuolar rim. Mean intensity signals were determined by a line profile across the vacuole. For details of image processing and quantification, see the Materials and Methods section. Cells (n ≥ 50) were counted from three independent experiments. (P value ***< 0.001 using a one-way ANOVA).
