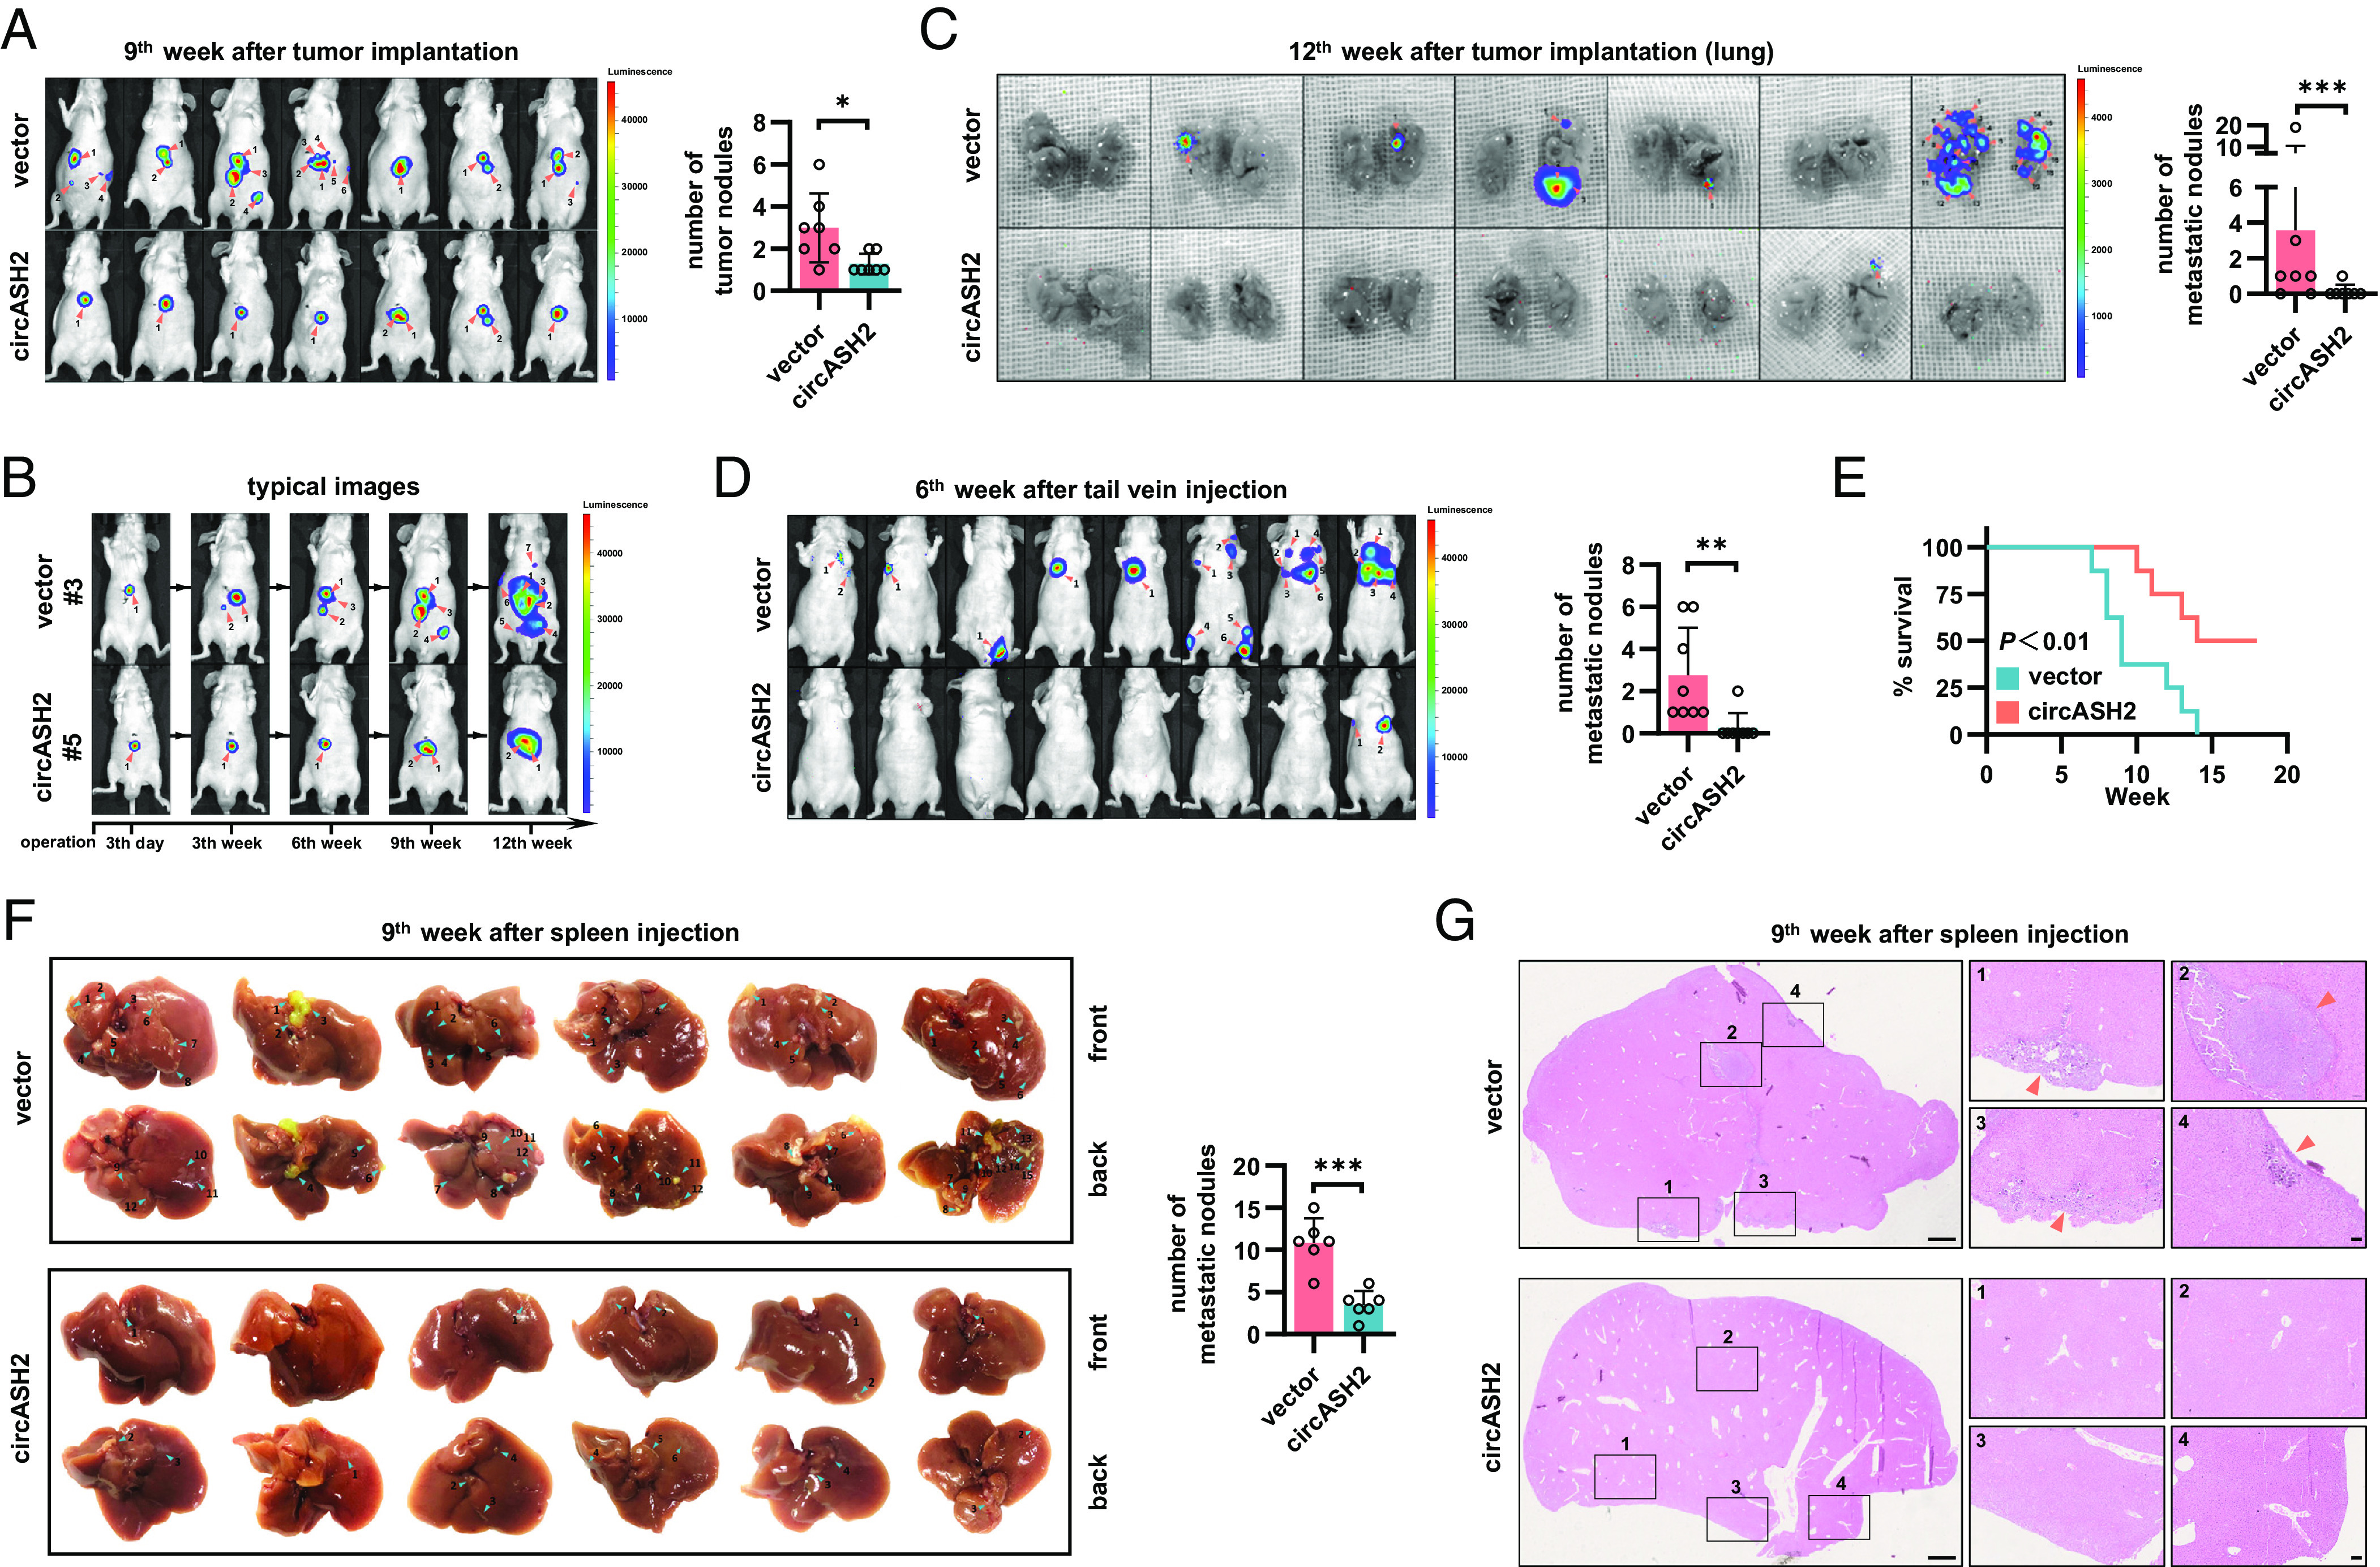
Fig. 2.

circASH2 suppresses HCC metastasis in vivo. (A, Left) In vivo image system (IVIS) images of HA22T tumors in the 9th week after transplantation (both local growth and metastases are marked with orange arrows, n = 7). (Right) Tumor foci are quantified (mean ± SD, **P < 0.01, unpaired Student’s t test). (B) Typical images of HA22T tumors (#3 mouse in the control group and #5 the mouse in the circASH2 group) at the indicated time (both local growth and metastases are marked with orange arrows). (C, Left) IVIS images showing pulmonary metastasis in mice scarified in the 12th week (metastases are marked with orange arrows, n = 7). (Right) Pulmonary metastases are quantified (mean ± SD, ***P < 0.001, unpaired Student’s t test). (D, Left) IVIS images of HA22T tumors in the 6th week after rapid tail vein injection (metastases are marked with orange arrows, n = 8). (Right) Tumor foci are quantified (mean ± SD, **P < 0.01, unpaired Student’s t test). (E) Kaplan–Meier curves showing overall survival of 16 mice with indicated HA22T tumors followed up to 18 wk (**P < 0.01, Gehan–Breslow test). (F, Left) Liver images of HA22T tumors in the 9th week after spleen injection (intrahepatic metastases are marked with blue arrows, n = 6). (Right) Intrahepatic metastases are quantified (mean ± SD, ***P < 0.001, unpaired Student’s t test). (G) Typical HE staining images of HA22T tumors in the 9th week after spleen injection. Left: (Scale bar, 1 mm.) Right: (Scale bar, 100 μm.)
