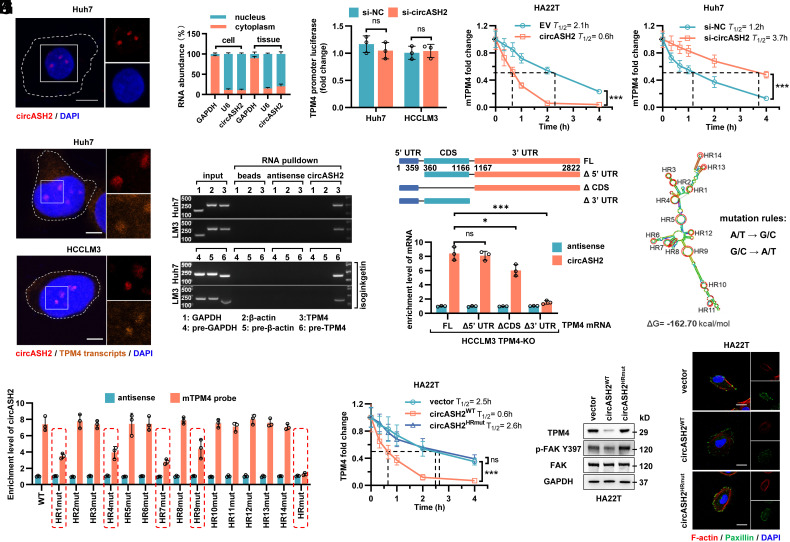
Fig. 5.
circASH2 promotes mRNA decay by physically connecting TPM4 transcripts. (A) Subcellular localization of circASH2 (red) in Huh7 cells revealed by FISH. Nuclei were labeled with DAPI (blue). (Scale bars, 10 μm.) (B) RT-qPCR detection of circASH2 from the indicated compartments of Huh7 cells and HCC tissues (n = 3). GAPDH mRNA and U6 RNA were used as reference RNAs from the cytoplasm and nucleus, respectively. (C) Dual-luciferase reporter assay of the TPM4 promoter (−2,000~0 bp) in si-NC and si-circASH2 HCC cells (n.s., not significant, unpaired Student’s t test). The firefly luciferase activity is normalized to the Renilla luciferase activity (firefly luciferase/Renilla luciferase) and presented as relative luciferase activity. (D) RT-qPCR detection of TPM4 mRNA in circASH2 overexpression or knockdown HCC cells treated with 2 μg/mL actinomycin D for the indicated times. The dashed line shows the half-life of TPM4 mRNA (mean ± SD, ***P < 0.001, two-way ANOVA test). (E) Representative FISH images of circASH2 (red) and TPM4 transcripts (orange, 40 nM, 55 °C, 2 h) showing a marked colocalization of them in Huh7 and HCCLM3 cells. DAPI (blue) was used to stain the nucleus. (Scale bars, 10 μm.) (F) The circRNA pulldown assay confirmed that circASH2 could bind with TPM4 mRNA and TPM4 pre-mRNA (treated with 10 μM isoginkgetin for 48 h). mRNA/pre-mRNA of GAPDH and β-actin were used as a negative control. (G, Top) Cartoon depicting the structure and sequence of TPM4 mRNA (including full-length transcript and 3 different truncations). (Bottom) TPM4-knockout HCCLM3 cells were reconstituted with TPM4FL, TPM4Δ5′UTR, TPM4ΔCDS, and TPM4Δ3′ UTR, respectively. RT-qPCR was used to detect the circASH2-enriched TPM4 mRNA levels in indicated cells (means ± SD, *P < 0.05, ***P < 0.001 and n.s., not significant, unpaired Student’s t test). (H) The predicted secondary structure and HR (1 to 14, denoted by red circles) of circASH2 was made by Mfold 2.3 software. Meanwhile, a schematic illustration of circASH2 mutations used in this study is shown. I. HA22T carrying indicated circASH2 plasmids (WT or HRmut) were used for detection of circASH2-TPM4 mRNA interaction. The enrichment level of circASH2 coisolated by TPM4 mRNA pulldown was detected by RT-qPCR. (J) RT-qPCR detection of TPM4 mRNA in indicated HA22T cells treated with 2 μg/mL actinomycin D for the indicated times. The dashed line shows the half-life of TPM4 mRNA (mean ± SD, ***P < 0.001 and n.s., not significant, two-way ANOVA test). (K) Endogenous TPM4 level and FAK activation in HA22T cells expressing WT or HRmut circASH2 were analyzed by immunoblots. GAPDH was used as an internal reference. (L) The state of cytoskeleton in indicated HA22T cells was shown by phalloidin staining of F-actin (red) and immunofluorescence of paxillin (green), while DAPI was used to stain the nucleus. (Scale bar, 10 μm.)

