
Figure 4. Performance of Wastewater Percentile in Reference to Clinical Case Metrics Stratified by Calendar Quartile of 2022.
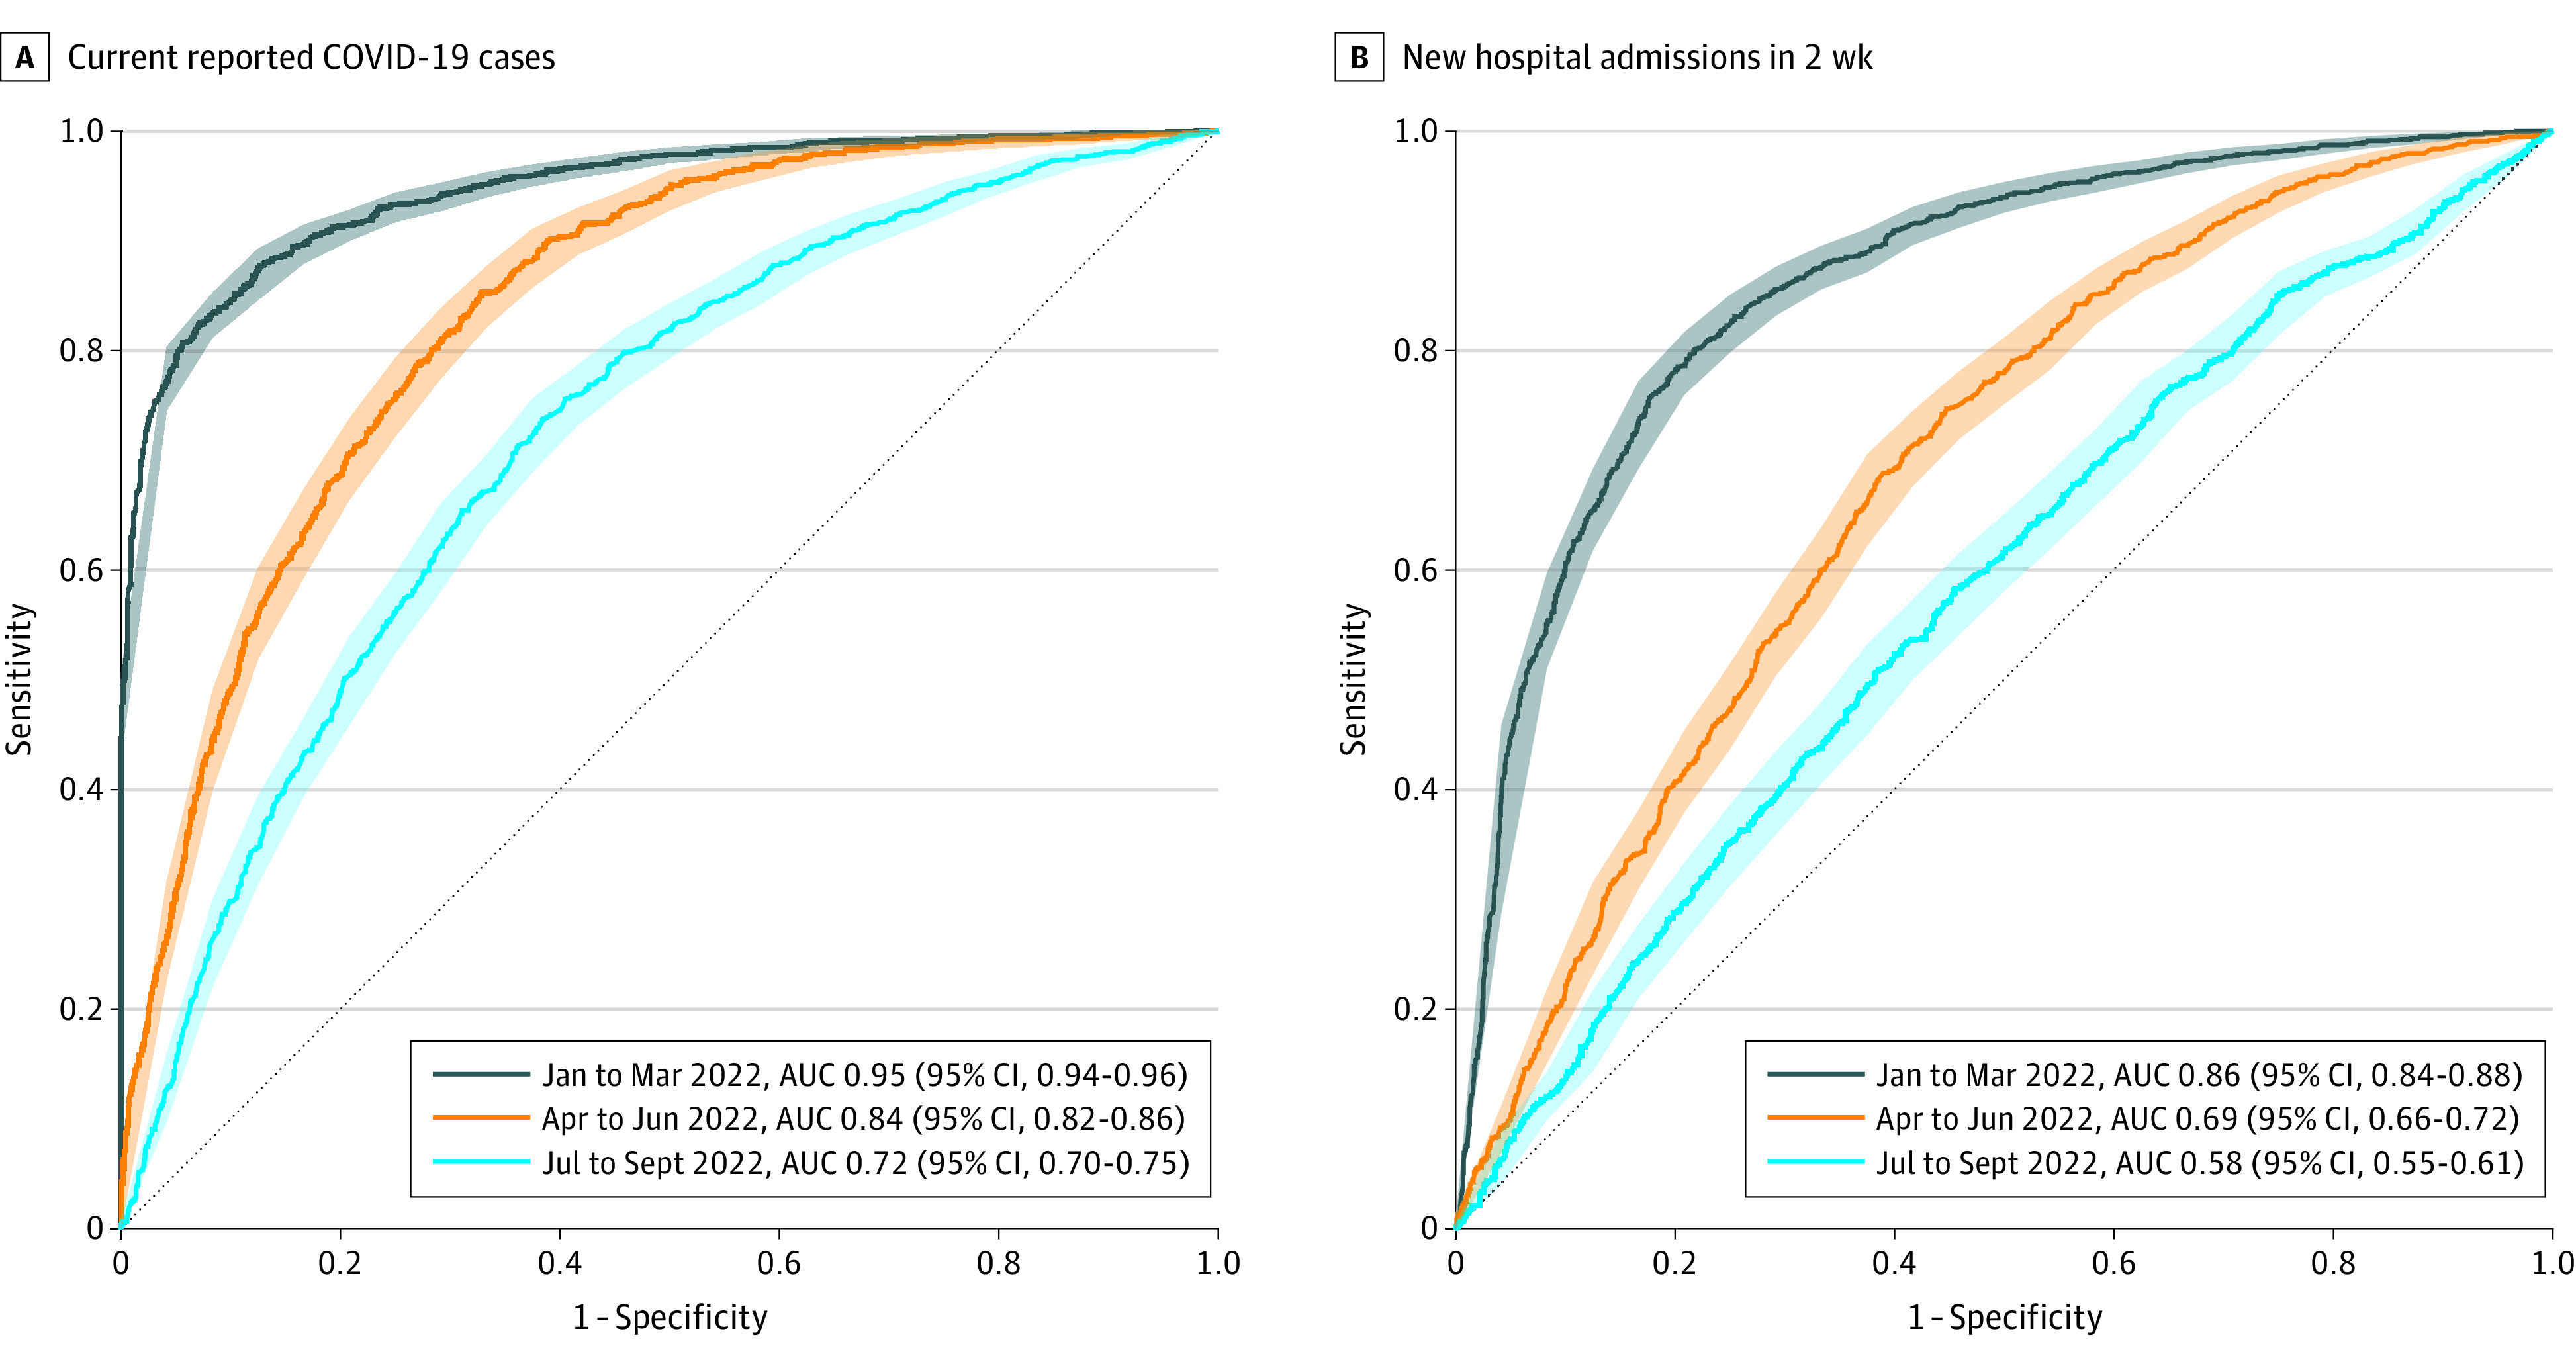
Graphs show areas under the curve (AUCs) of wastewater percentile in reference to current reported COVID-19 cases (≥200 per 100 000 population) (A) and new hospital admissions in 2 weeks (≥10 per 100 000 population) (B). Shaded ribbons show bootstrapped 95% CIs for sensitivity at given specificity.