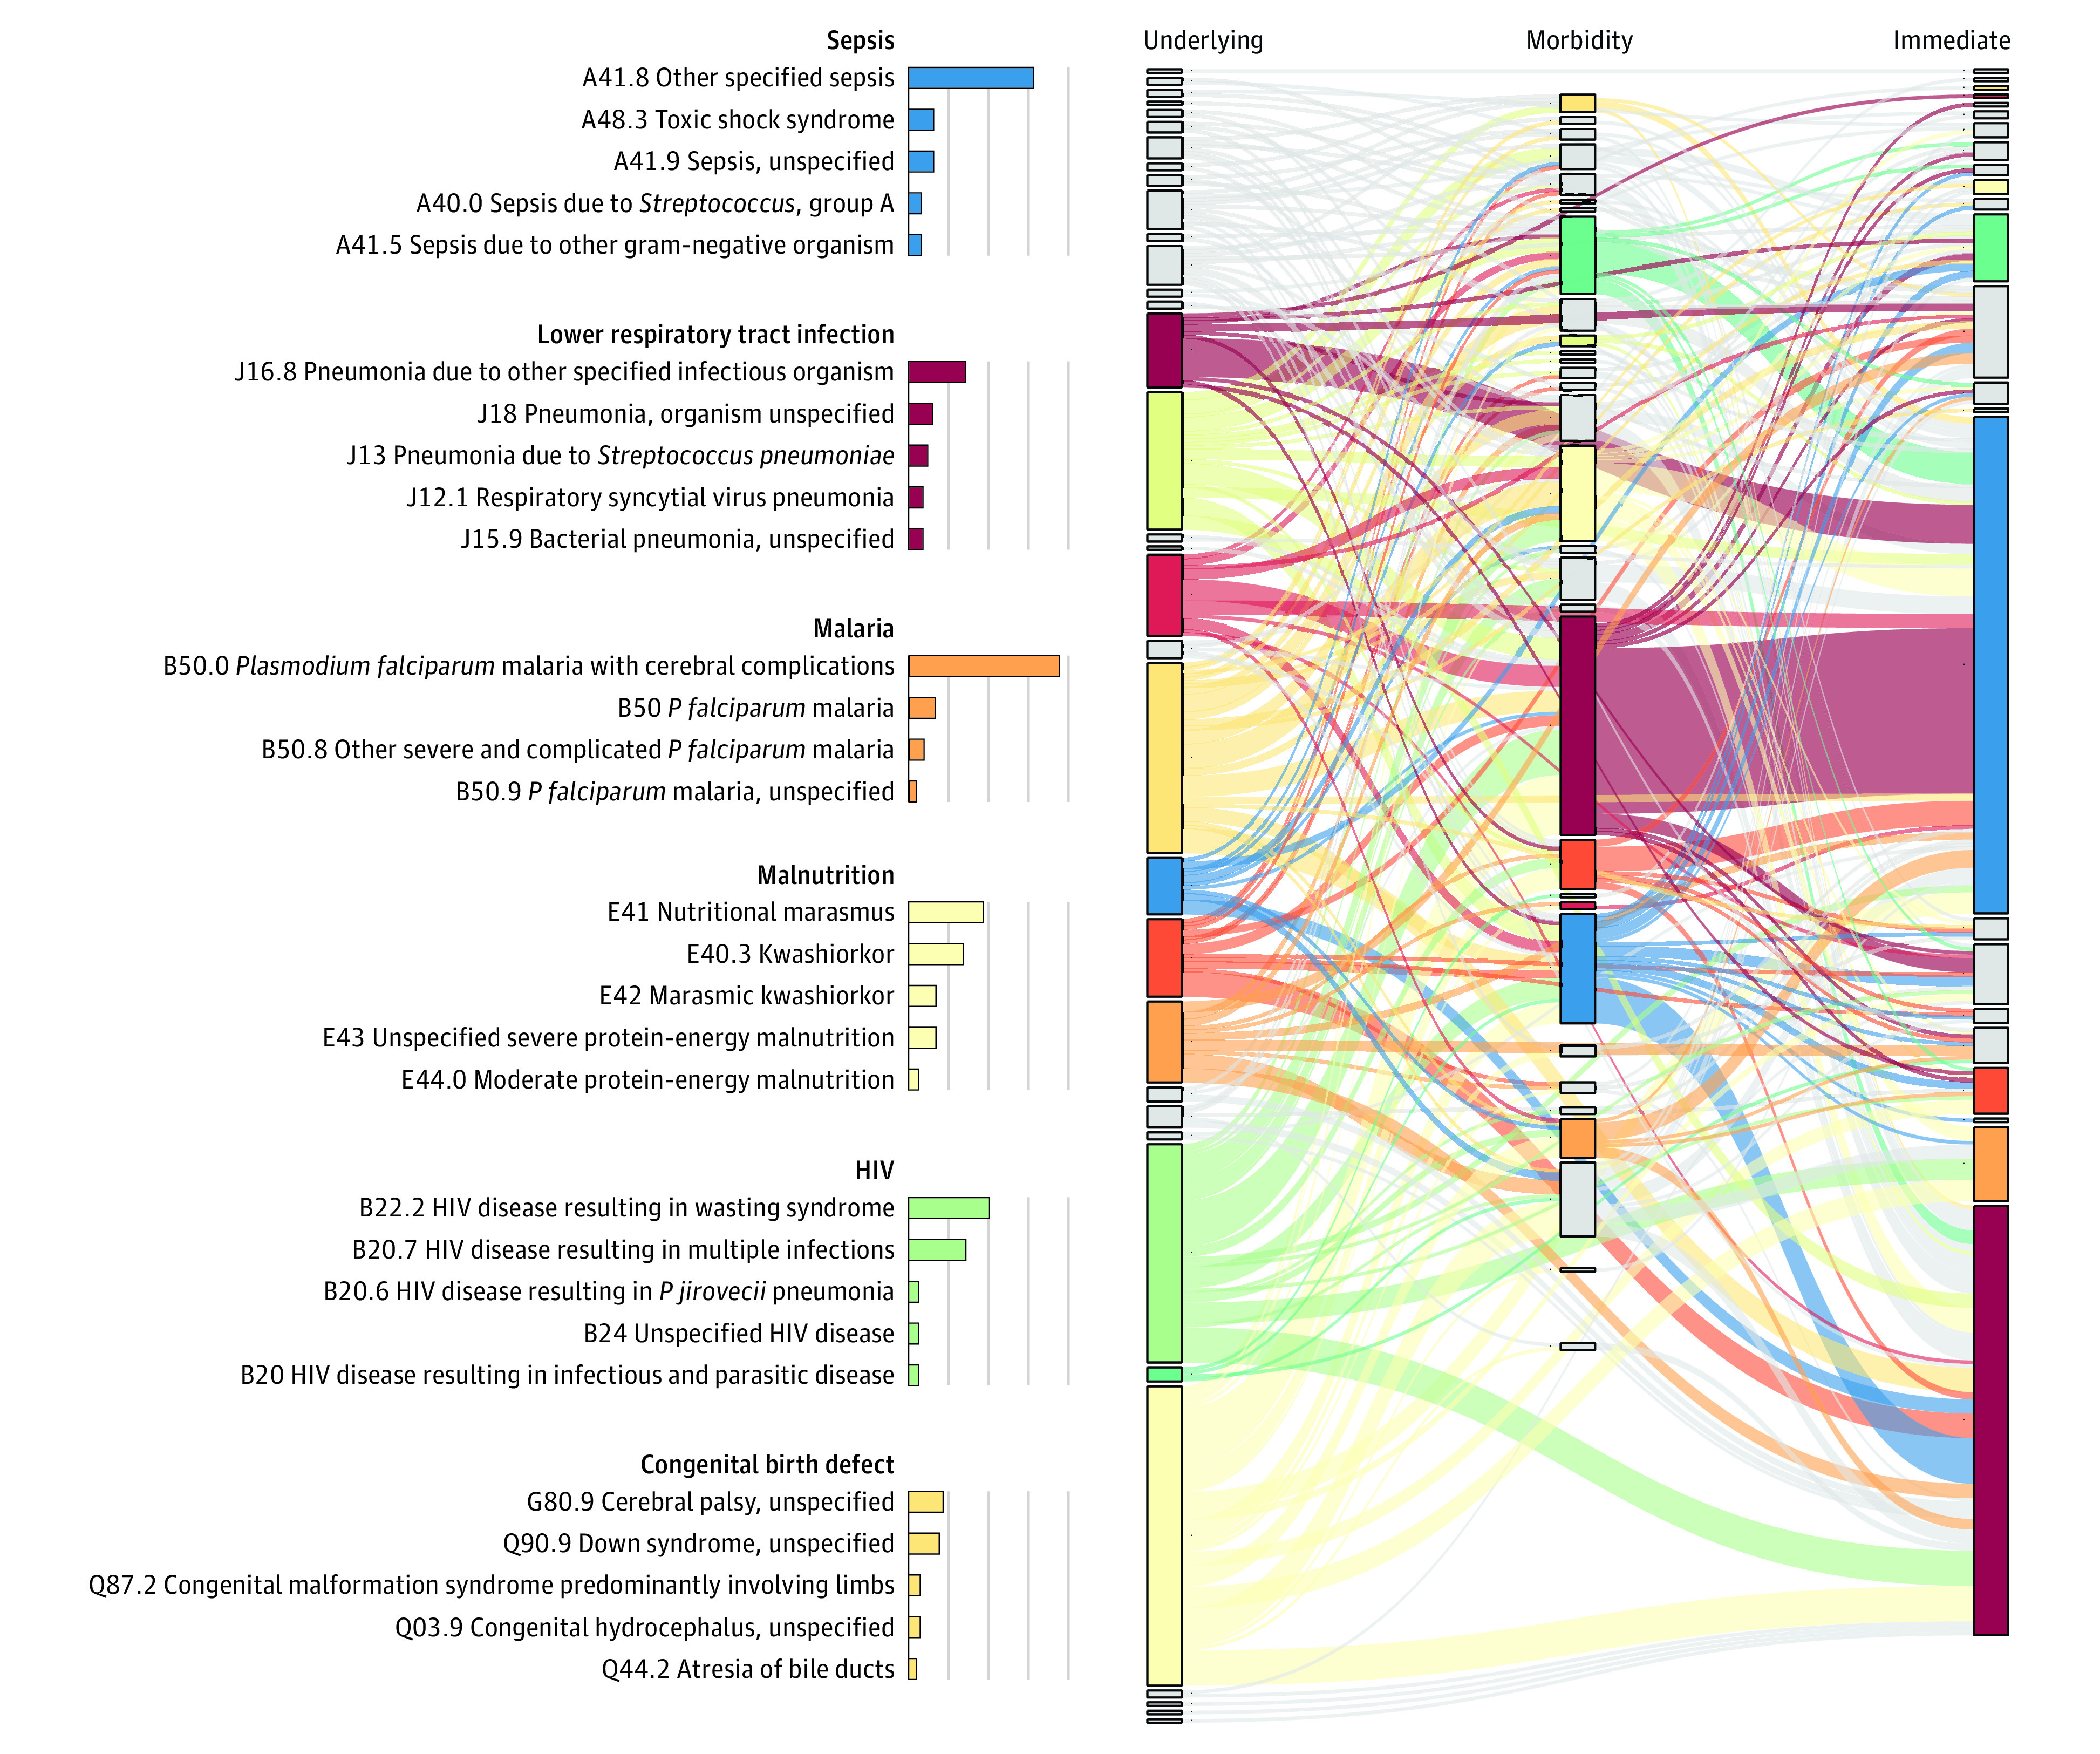
Figure 1. Sankey Diagram Illustrating the Pathways Linking the Different Steps (Underlying Causes, Pooled Morbid or Intermediate Conditions, and Immediate Causes) of the Causal Pathway Leading to Death.

For the major causes, a more detailed breakdown of their characteristics is shown. Note that only cases with 2 or more events are shown in the Sankey diagram (ie, to avoid confusion); cases with only 1 event (ie, the underlying cause is the immediate cause) are not depicted. Data supporting this figure are available in eTable 5 in Supplement 1. As an example, in the left column (underlying causes), the different diagnoses related to malnutrition (E4* International Statistical Classification of Diseases and Related Health Problems, Tenth Revision [ICD-10] codes, pale yellow color) represent the largest proportion of underlying causes, linking to a myriad of morbid causes, but in particular with lower respiratory infections and sepsis (as morbid or immediate cause of death).
