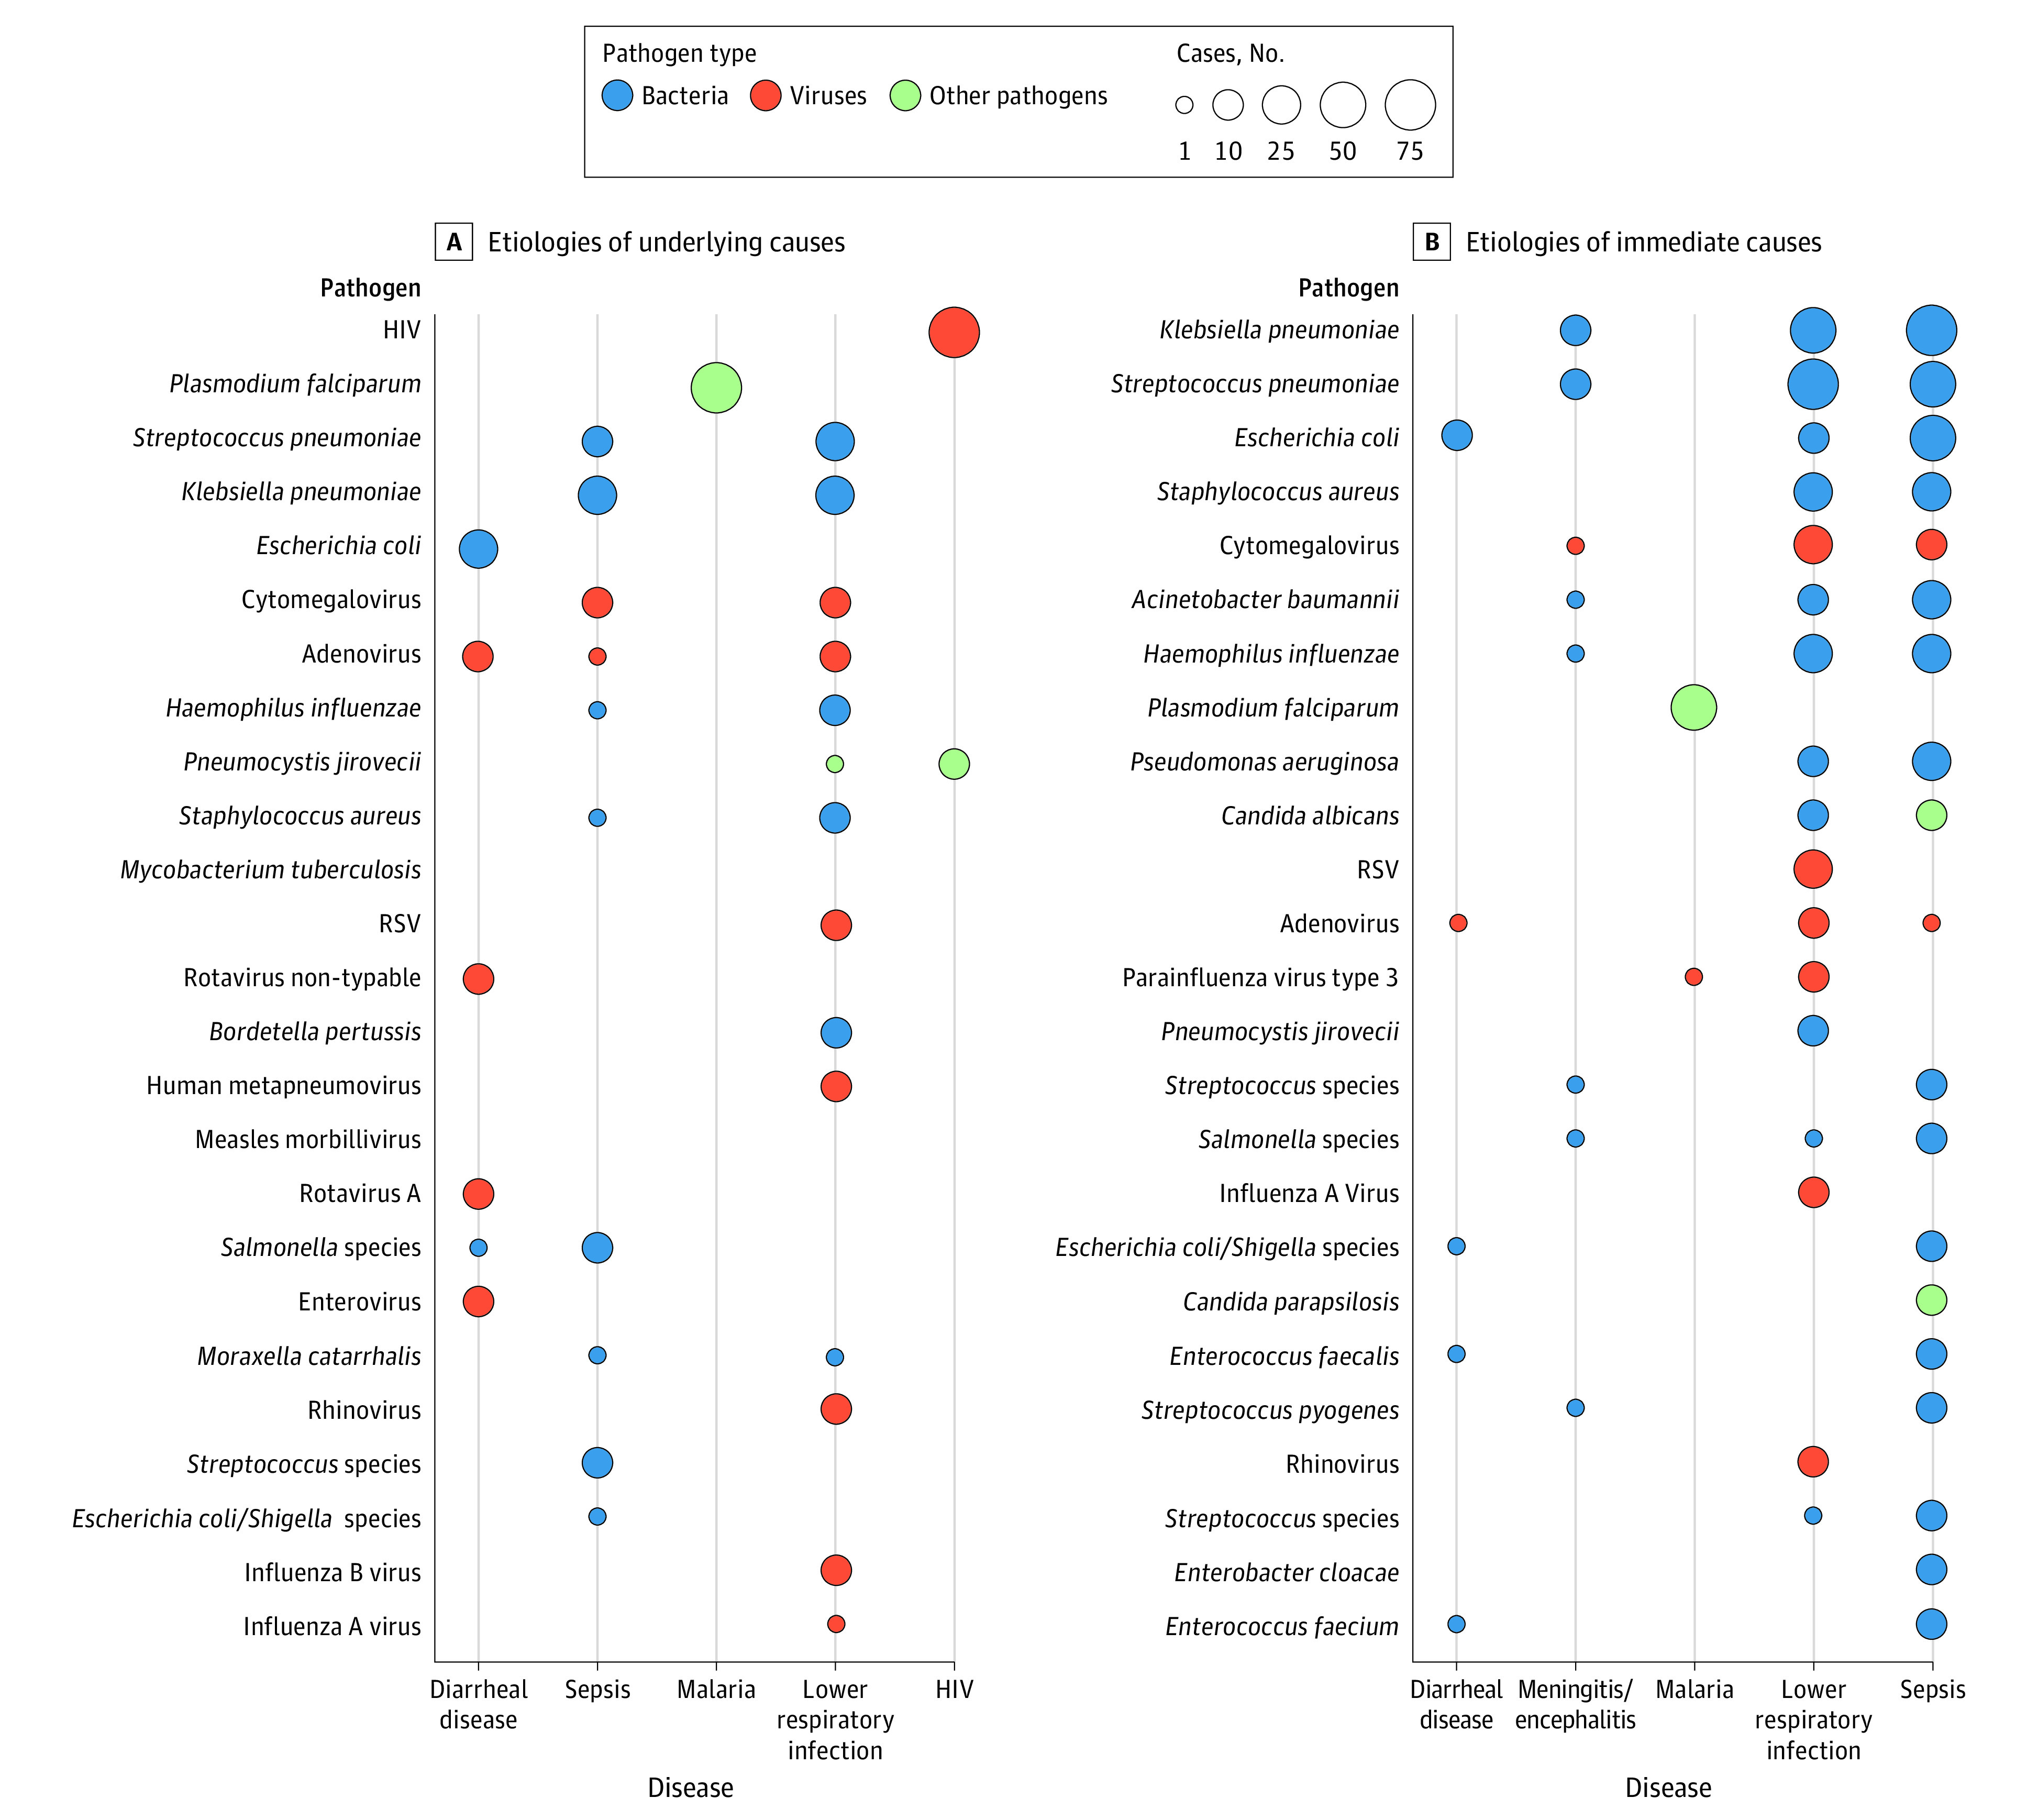
Figure 3. Relative Contribution of Different Pathogens to the Most Common Syndromes or Conditions .

Common syndromes or conditions are identified as underlying causes (270 disease-pathogen pairs; A) and immediate causes (479 disease-pathogen pairs; B). The size of the bubble is proportional to the number of cases detected (see eTable 7 in Supplement 1 for details). Note that, according to coding practice, deaths with only 1 cause identified have that cause listed as the underlying cause and no immediate cause of death assigned.
