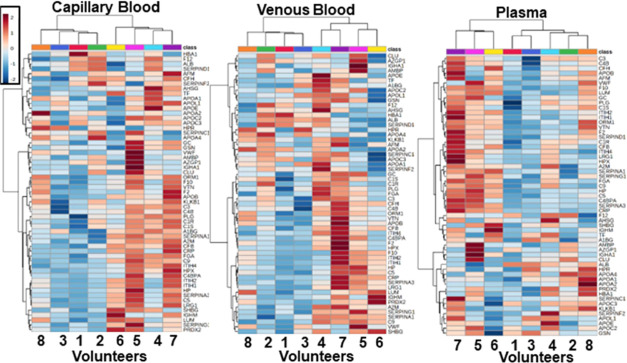
Figure 4.
Each volunteer has a unique heat map biomarker biosignature across capillary blood, venous blood, and plasma. Hierarchical clustering heat map distribution of HSP proteins from 8 volunteers’ capillary blood, venous blood, and plasma. The averages of replicates (capillary blood n = 6, venous blood n = 6, plasma n = 3) were grouped for each volunteer using the Euclidean distance measure and Ward clustering from T-test/NOVA calculations.

