Figure 1.
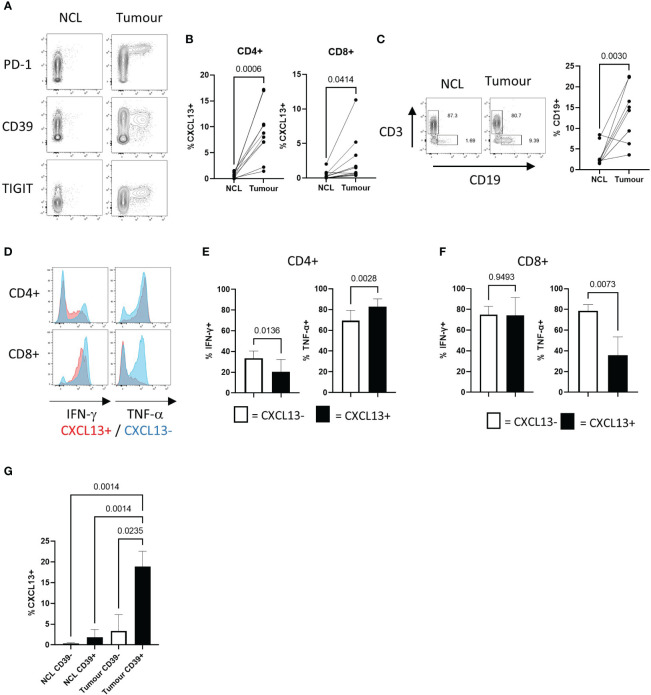
NSCLC Tumours contain recently activated CXCL13 producing T cells expressing multiple co-inhibitory molecules with decreased potential for cytokine production (A) Contour plots showing flow cytometry staining for PD-1, CD39, and TIGIT expression against CXCL13 production detected in CD4+ T cells from non-cancerous lung (NCL (left hand panels)) and NSCLC tumour samples ex-vivo (right hand panels). (B) Percentage of cells expressing CXCL13 in NCL and Tumour samples (n=10) (within CD4+ or CD8+ populations respectively). Statistical analysis by paired T test. (C) Proportions of CD19+ B cells amongst lymphocytes from paired NCL and tumour samples (n=10). Statistical analysis by paired T test. (D) Cytokine production in CXCL13- and CXCL13+ Tumour infiltrating T cells (CD4+ in upper panels CD8+ in lower panels). (E) IFN-γ production and TNF-α production within CXCL13- and CXCL13+ CD4+ tumour infiltrating T cells (n=5). Statistical analysis by paired T test. (F) IFN-γ production and TNF-α production within CXCL13- and CXCL13+ tumour infiltrating CD8+ T cells (n=5). Statistical analysis by paired T test. (G)) The frequency of CXCL13+ cells within CD39- and CD39+ populations of CD4+ T cells in NCL and Tumour samples (n=5). Statistical analysis by one way ANOVA with Tukey’s multiple comparison test.

