Figure 4.
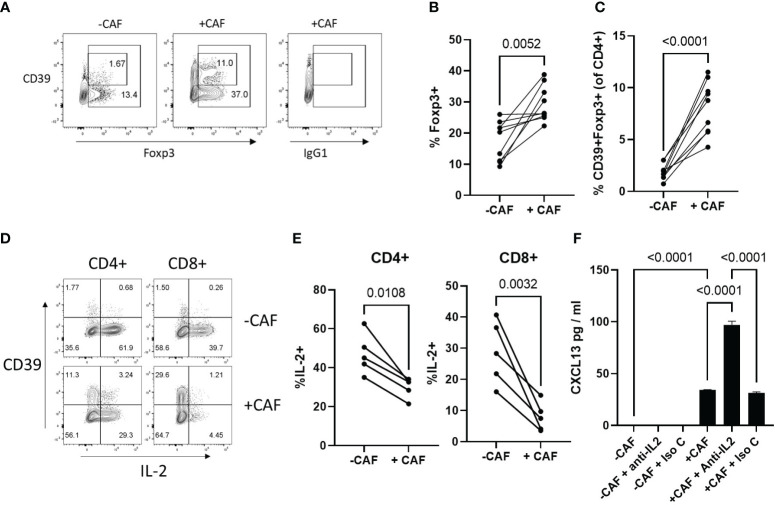
CAF promote expansion of Tregs and limit IL-2 production during T cell activation (A) Expression of CD39 (Y-axis) and Foxp3 (X-axis) or isotype matched control for Foxp3 staining (IgG1) within the CD4+ T cell population after activation in the absence (left hand panel) or presence (middle/right panels) of CAF. (B) Proportion of CD4+ T cells expressing Foxp3 after 96hrs activation in the presence or absence of CAF (n=9 across 4 independent experiments). Statistical analysis by paired T test. (C) Proportion of CD4+ T cells co-expressing CD39 and Foxp3 after 96hrs activation in the presence or absence of CAF (n=9 across 4 independent experiments). Statistical analysis by paired T test. (D) Expression of CD39 (Y-axis) and IL-2 (X-axis) in CD4+ and CD8+ T cells activated in the presence (lower panels) or absence (upper panels) of CAF. (E) Proportion of CD4+ (left hand panel) and CD8+ T cells (right hand panel) producing IL-2 (n=5 across 2 independent experiments). Statistical analysis by paired T test. (F) CXCL13 production by T cells, activated in the presence or absence of CAF, with the indicated addition of either anti-IL2 or isotype matched control antibody (both at 2 μg/ml) data is from one of two independent experiments analysed by ANOVA with Tukey’s multiple comparison test.

