
Figure 3.
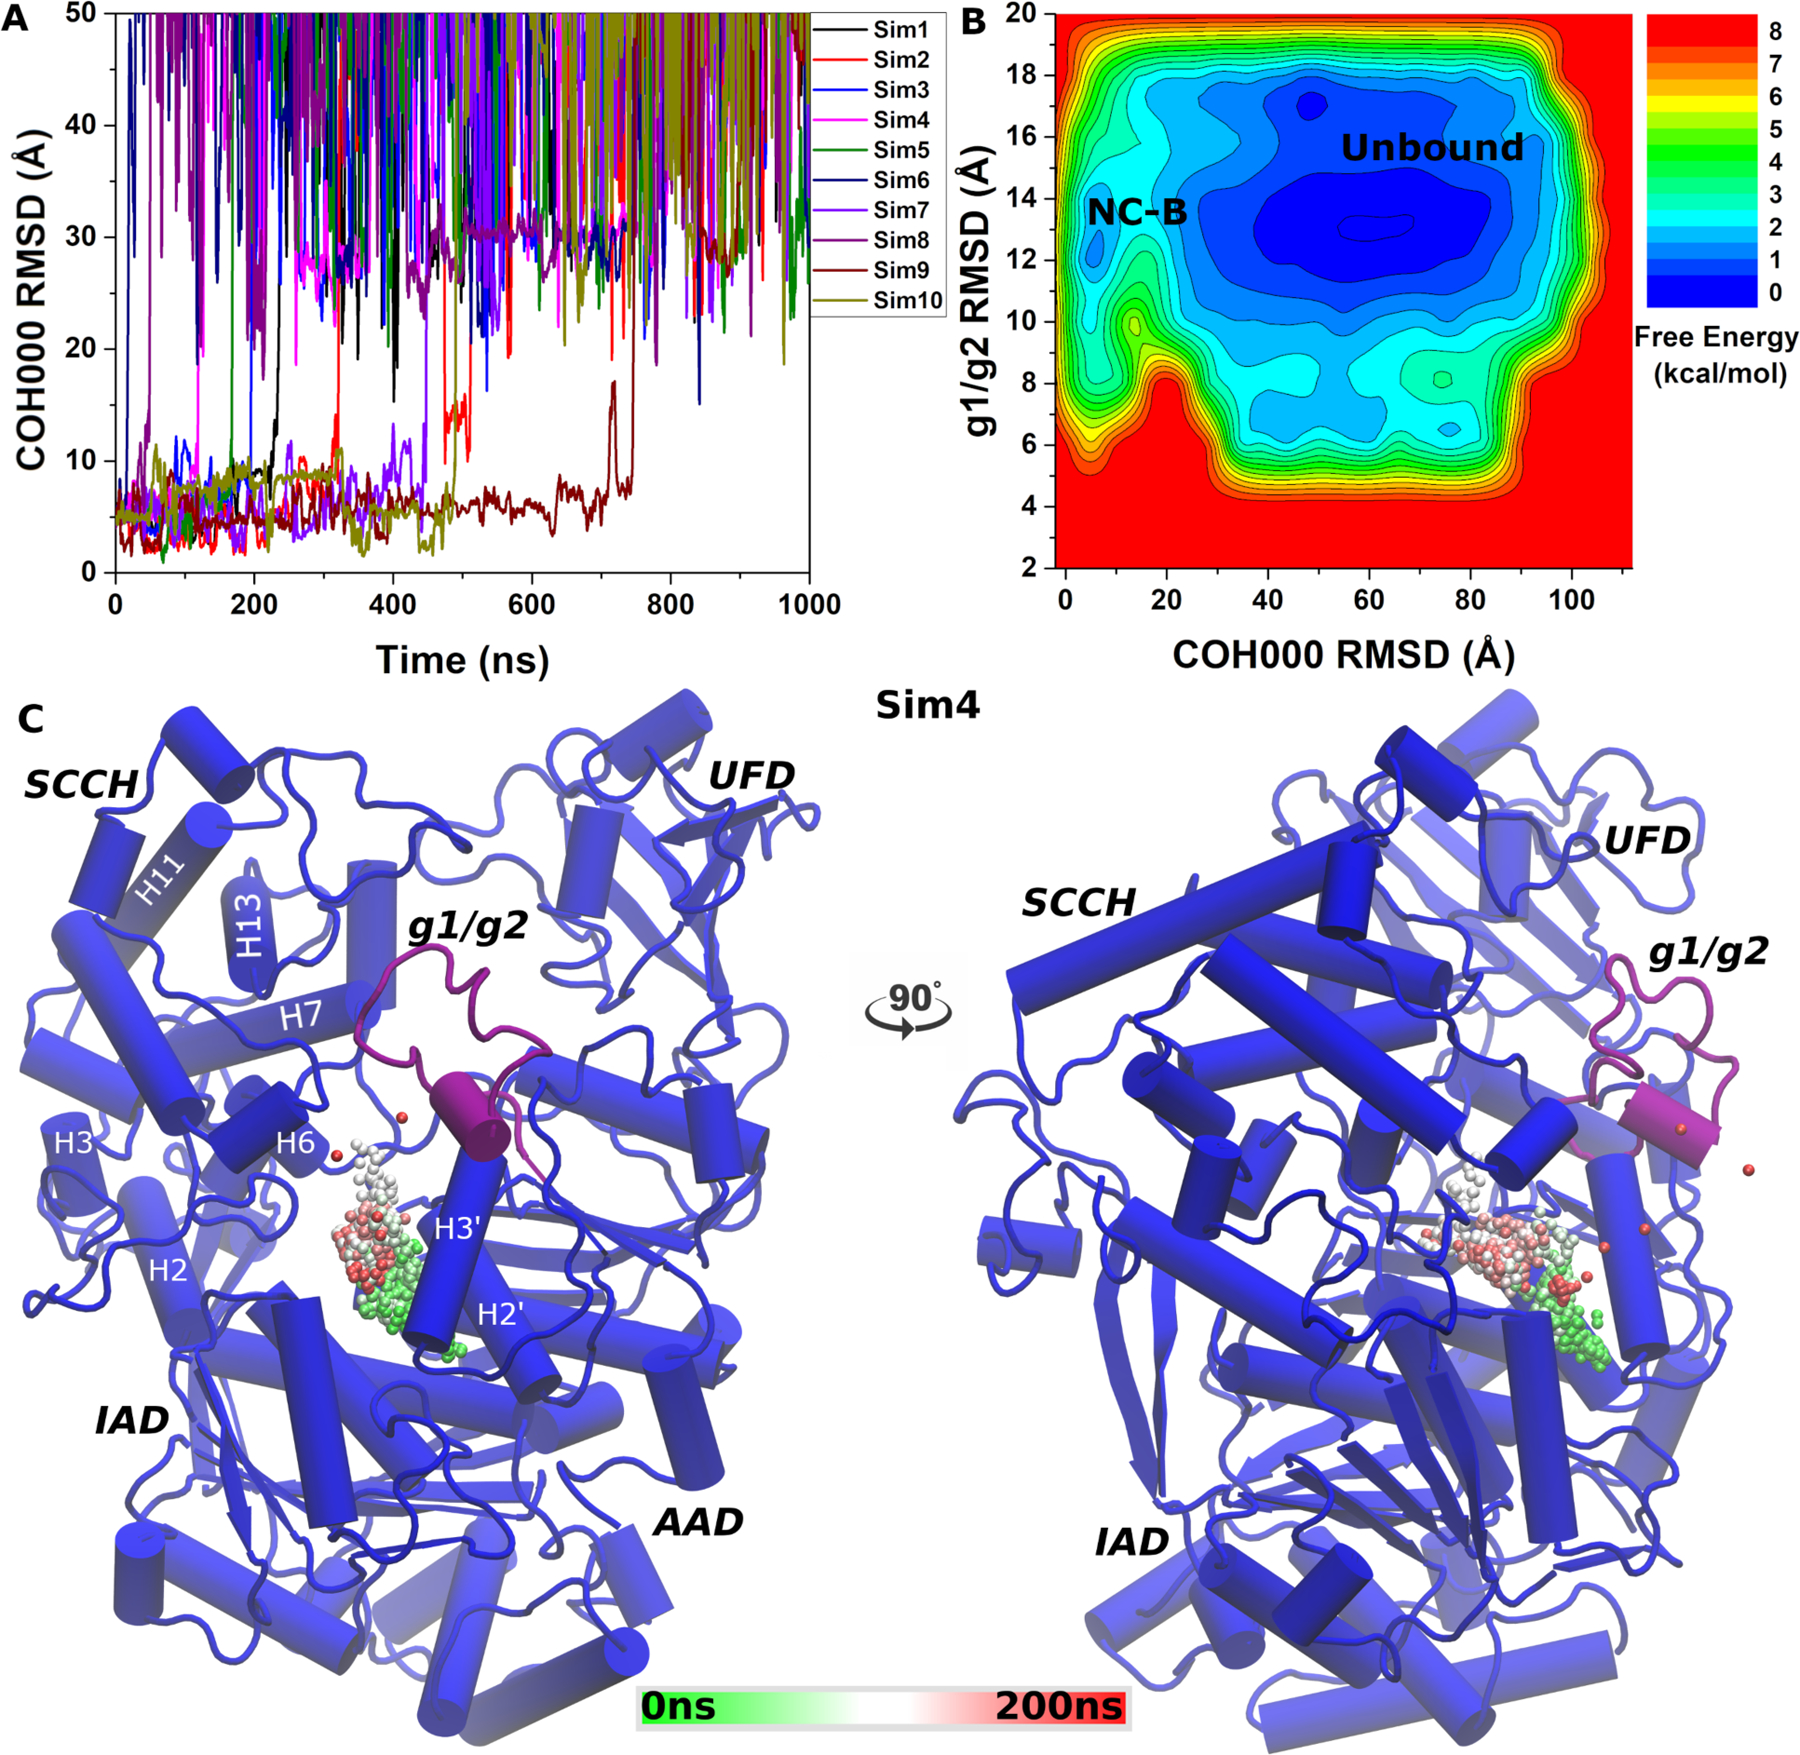
(A) Time course of COH000 RMSD relative to the X-ray conformation observed in 10 independent LiGaMD simulations. (B) Free energy profiles calculated regarding the COH000 RMSD relative to the X-ray conformation and g1/g2 RMSD relative to the starting computational model. The LiGaMD simulations sampled two low-energy conformations labeled “Non-covalent Bound” (NC-B) and “Unbound”. (C) Representative COH000 dissociation pathway from the allosteric binding pocket to the bulk solvent observed in “Sim3”. The dissociation pathway observed in the other LiGaMD simulations are shown in Figure S1.