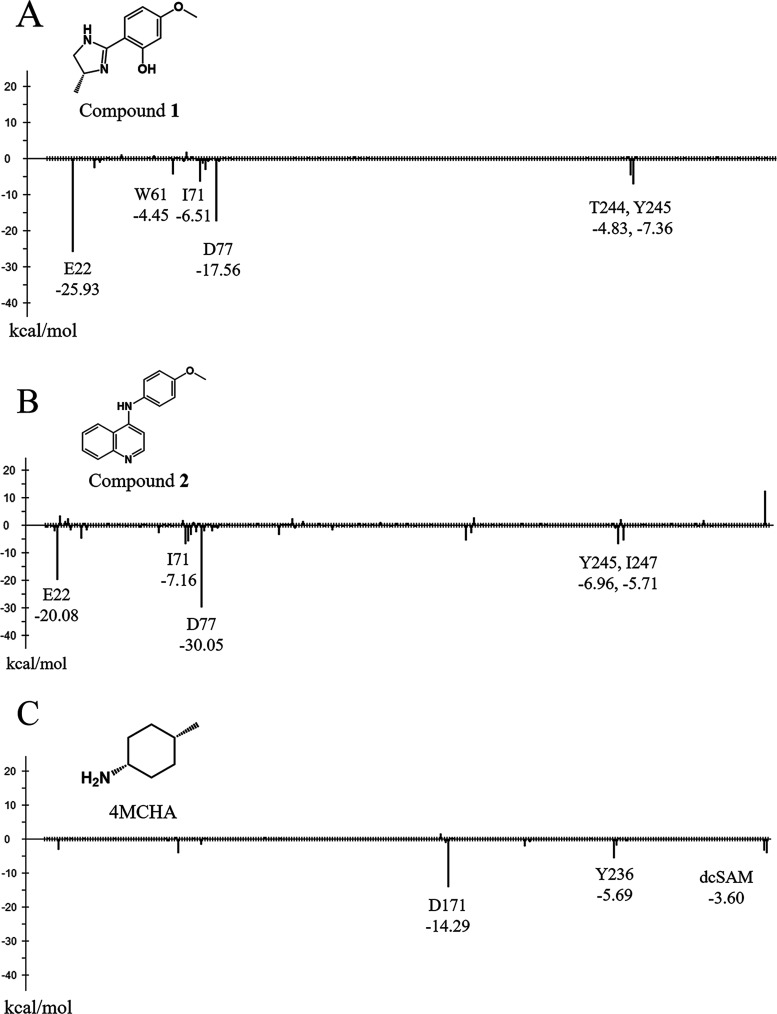
Figure 5.
Interaction energy analysis of each X-ray structure. (A) interaction energy of compound 1, (B) interaction energy of compound 2. (C) interaction energy of cis-4-methylcyclohexanamine (4MCHA, PDB ID: 2PT9). The y-axis represents the interaction energy (kcal/mol) between the ligand and each amino acid residue, and the x-axis represents the amino acid residue number.

