
Figure 1.
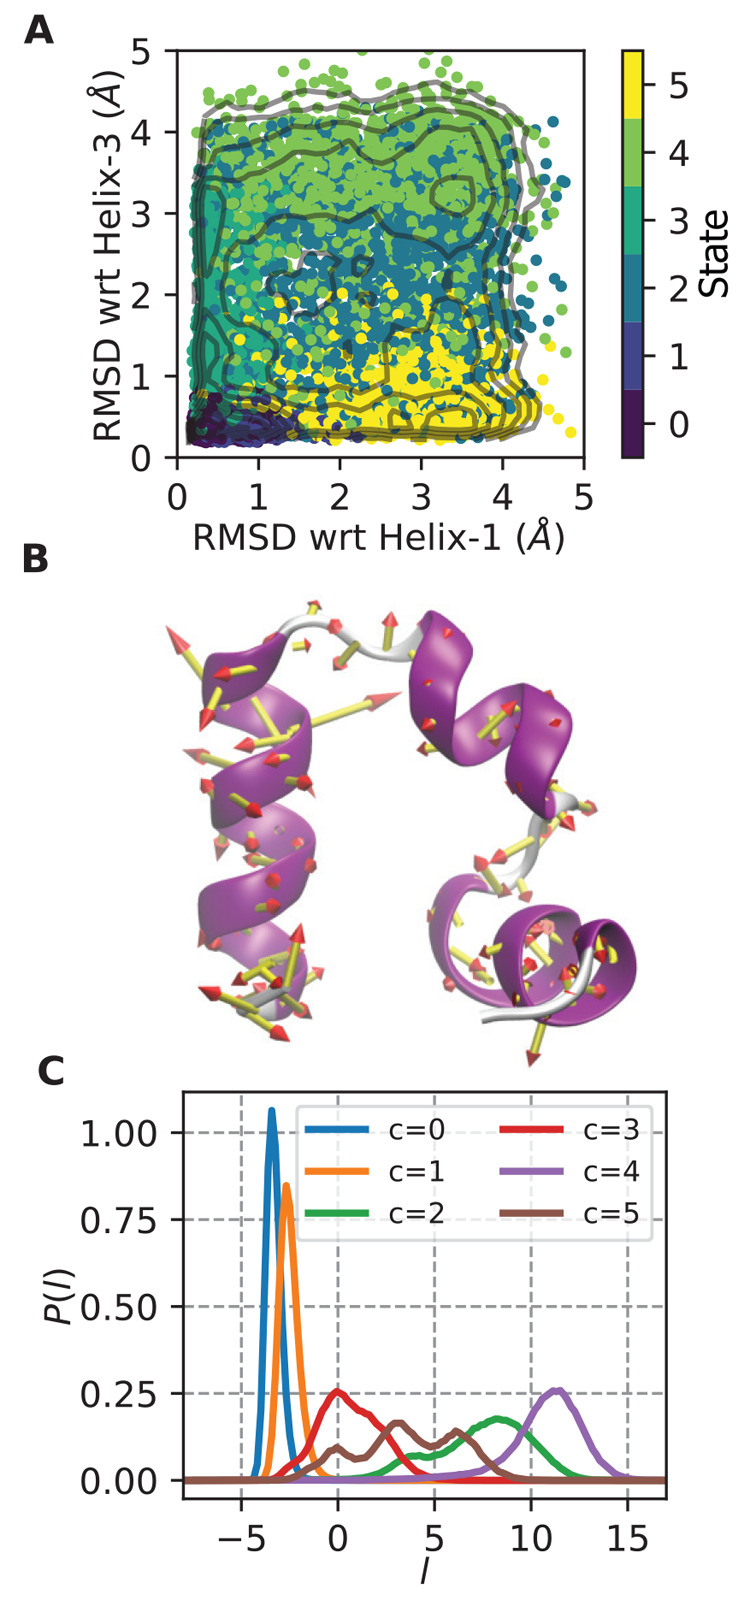
Folding/unfolding coordinate for HP35. (A) Points from HP35 trajectory are colored by state assignment and mapped into natural folding coordinates of the RMSD of residues in helix 1 or helix 3 to that in the folded state (which is a 3 helix bundle). State 0 is the most folded state, and state 4 is the most unfolded state. Contours shown are every 0.5 kcal/mol in the range (0,6). (B) Porcupine plot showing the magnitude of the LDA coefficients trained only on states 0 and 4 from A, overlaid on the starting HP35 structure. (C) Histogram of LDA coordinate l for each separate state. l evenly separates all states, with states 0 and 4 at maximum separation.