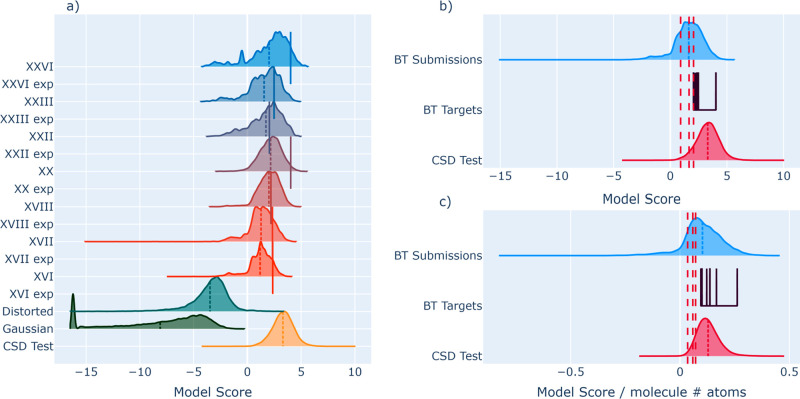
Figure 7.
Blind Test submission scores distributions and means (dashed lines) as well as targets (solid lines). All targets and test data in panel a), combined distributions of test data and all submissions in panels b) and c), with the scores in c) normalized by the molecule size. Red dashed lines in b) and c) correspond to the 1%, 5%, and 10% quantiles of the CSD test distribution.

