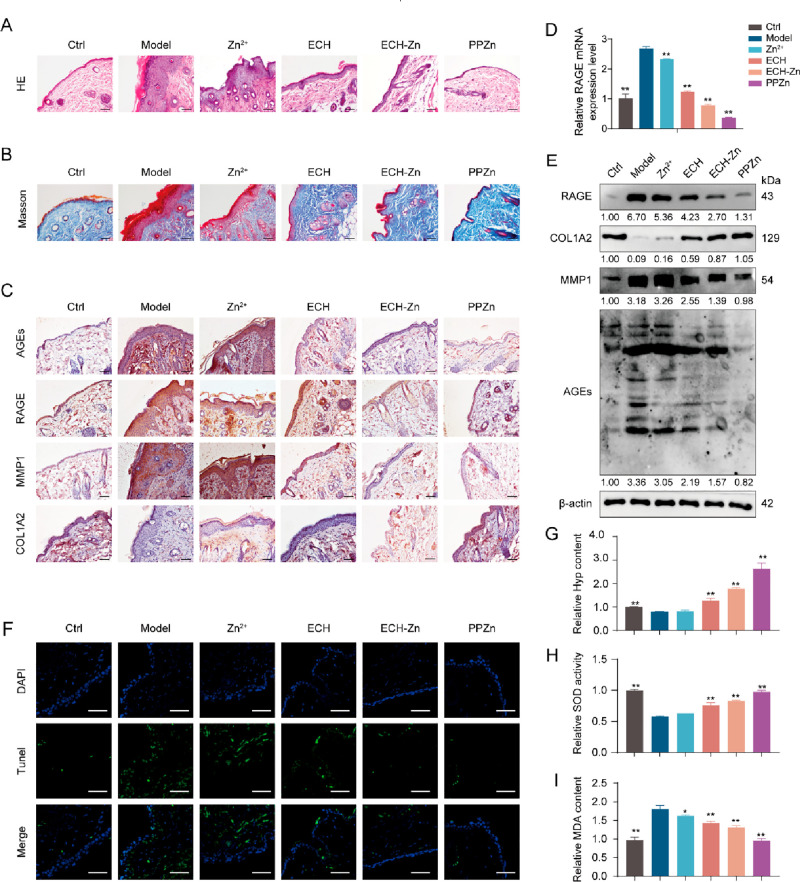
Figure 2.
PPZn exerted anti-antiglycan in glycated model mouse skin. (A–C) Representative images of immunohistochemical (IHC) staining (A–a), HE staining (B–a), and Masson staining (C–a) of mouse skin tissue after the indicated treatment. The statistical results of the IHC staining index (A–b), epidermal thickness (B–b), and collagen density (C–b) are shown on the right. Scale bar, 50 μm. (D) qRT-PCR detection of RAGE mRNA levels in skin tissues of mice after the indicated treatment. (E) Western blot representative images and quantitative analysis of RAGE, COL1A2, MMP1, AGEs, and β-actin protein levels in skin tissues of mice after the indicated treatment. (F) Representative images of TUNEL staining of mouse skin tissue after the indicated treatment. Scale bar, 50 μm. (G–I) Relative Hyp content (G), SOD activity (H), and MDA concentration (I) in skin tissues of mice after the indicated treatment. All values are presented as the mean ± SD; P-values determined by two-sided Student’s t test. *P < 0.05, **P < 0.01, compared with the model.

