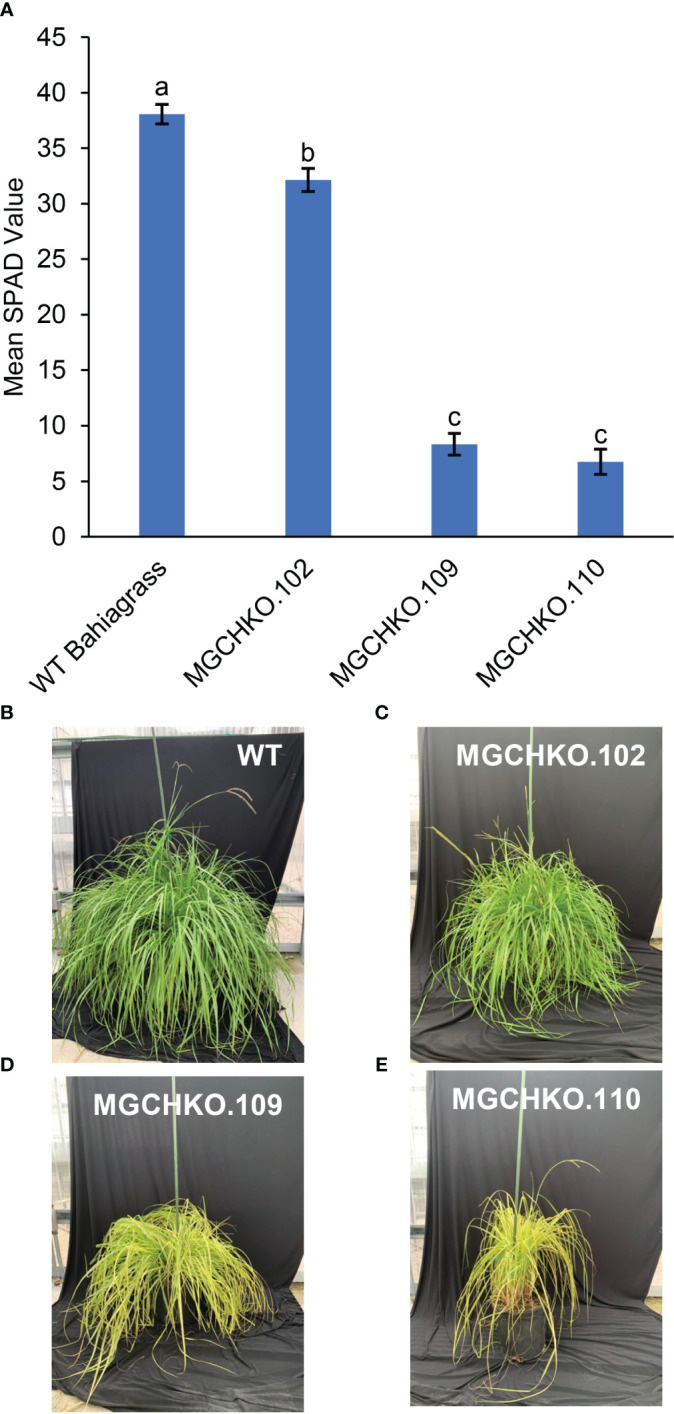
Figure 7.

Phenotypic evaluations of leaf greenness in wild type (WT) and MgCh mutant lines. (A) Bar graph comparison of mean SPAD measurements of leaf greenness from leaves (n=5) of WT bahiagrass and three MgCh mutant lines MGCHKO.102, MGCHKO.109, and MGCHKO.110. Error bars indicate ± standard error of the mean. Data bars labelled with different letters are determined to be significantly different based on Tukey’s HSD (α=0.05; HSD=4.08). (B–E) Left to right: visual phenotypes of (B) WT bahiagrass, (C) MGCHKO.102, (D) MGCHKO.109, and (E) MGCHKO.110 at flowering stage.
