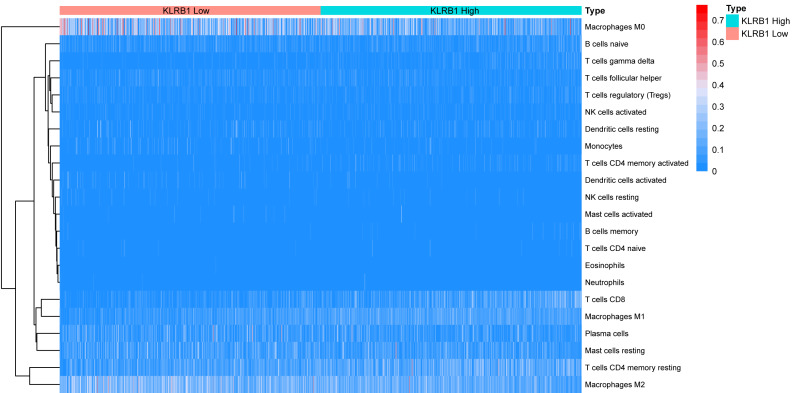
Figure 11. The association between 22 distinct leukocyte subsets and high and low expression groups of KLRB1 shown by heatmap.
The high expression group of KLRB1 showed the higher expression of T cells CD8, T cells CD4 memory resting, and macrophages M1, and lower expression of macrophages M0 and macrophages M2.

