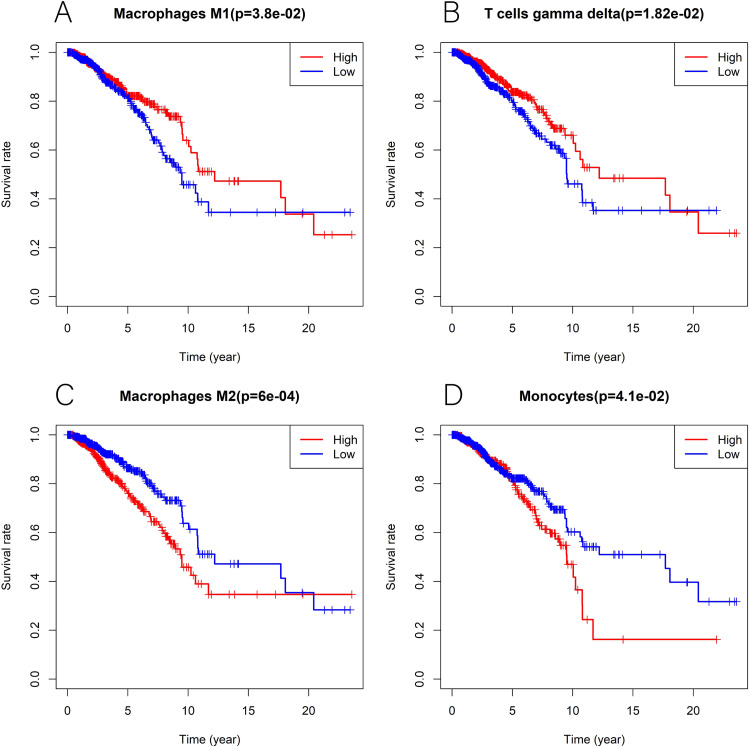
Figure 14. Kaplan-Meier curves in breast cancer according to the high and low expression of distinct leukocyte subsets.
The survival analysis showed significantly higher expression of macrophages M1 (A) as well as T cells gamma delta (B), and lower expression of macrophages M2 (C) and monocytes (D) was associated with higher survival rate in breast cancer.

