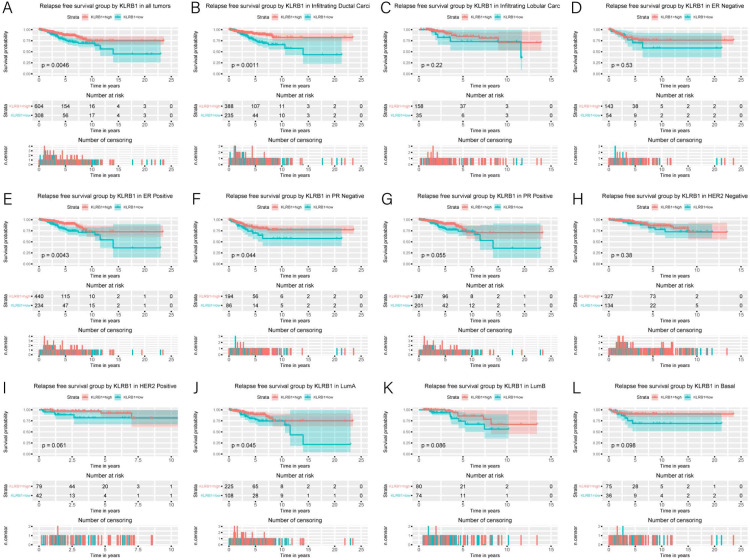
Figure 5. Kaplan-Meier curves of RFS in breast cancer according to KLRB1 expression in breast cancer tissues.
Relapse free survival analysis (A) and subgroup analyses of histological type (B and C), ER (D and E), PR (F and G), HER-2 (F and G), and molecular subtype (J, K, and L). Low KLRB1 expression showed a relationship with poor relapse free survival (p = 0.0046).

