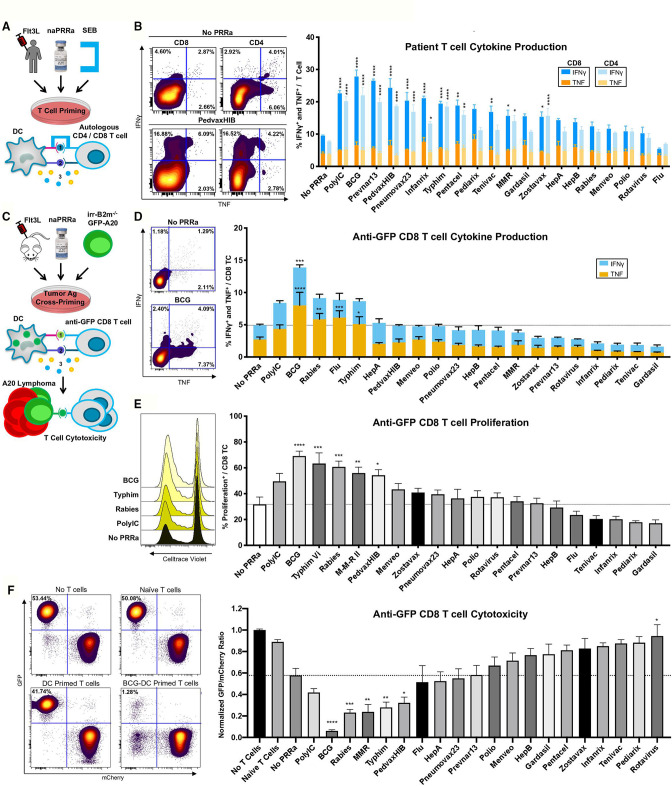
Figure 2.
naPRRa-activated DC effectively prime and cross-prime T-cells. (A) Schema of SEB assay. PBMCs from four Flt3L-treated patients were treated with naPRRa and SEB. T-cell activation was measured by flow cytometry. (B) Representative scatter plots and bar graph summarizing CD8 and CD4 T-cell IFN-γ and TNF production in response to SEB+naPRRa. Statistical significance was calculated against ‘No PRRa’ condition by two-way ANOVA with Tukey’s multiple comparisons test. (C) Schema of the cross-presentation assay. DCs were cocultured with XRT B2m-/-GFP-A20, activated with naPRRa, and used to cross-prime anti-GFP CD8 T-cells. CD8 T-cell activation was measured as (D) production of IFN-γ and TNF and (E) proliferation. (F) After 96 hours of cross-priming, GFP/mCherry-A20 cells were added to assess anti-GFP CD8 T-cell cytotoxicity. Representative scatter plots and bar graph showing normalized GFP/mCherry ratio after 24 hours coculture with anti-GFP CD8 T-cells. Decreasing ratio indicates loss of GFP-A20, mediated by cytotoxic anti-GFP CD8 T-cells. Statistical significance was calculated by two-way ANOVA (D) or one-way ANOVA (E, F) with Dunnett’s multiple comparison test, comparing to the ‘No PRRa’ condition. ANOVA, analysis of variance; DC, dendritic cells; PRRa, pattern recognition receptor agonists; SEB, staphylococcus enterotoxin B.

