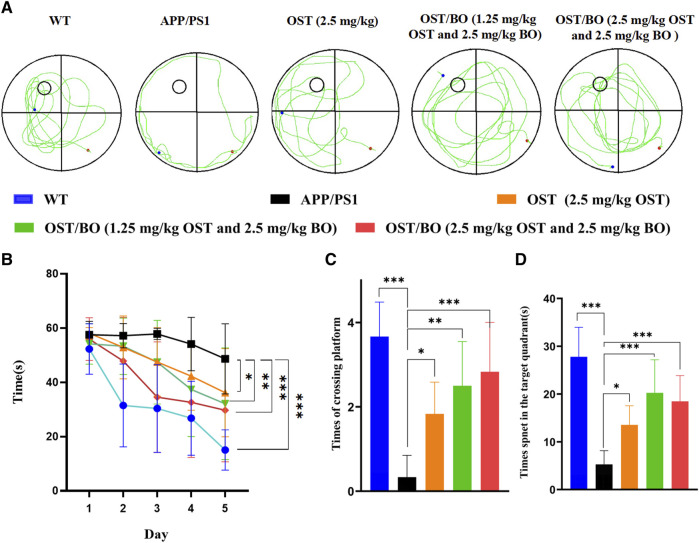
FIGURE 5.
(A) Tracings of animal paths during the positioning navigation test on Day 6. Statistical analysis of (B) escape latencies in water maze during the positioning navigation test, (C) number of times of crossing the platform location during the probe trial, and (D) time spent in the target quadrant during the probe trial. Statistical significance denoted as *p < 0.05, **p < 0.01, ***p < 0.001, (n = 3).

