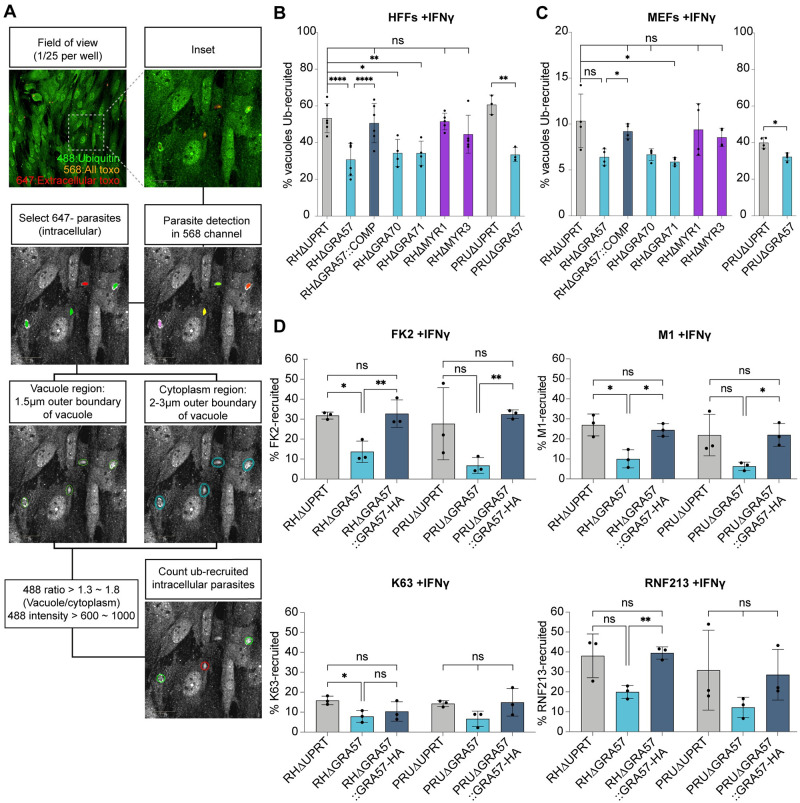
Fig 5. Deletion of GRA57, GRA70, or GRA71 leads to reduced host ubiquitin recruitment to the PVM.
(A) Schematic of automated high-content imaging analysis pipeline to determine ubiquitin recruitment levels. (B, C) Recruitment of total host ubiquitin (FK2) to Toxoplasma vacuoles in (B) HFFs and (C) MEFs. Host cells were pre-stimulated with 100 U/ml IFNγ for 24 h, infected with indicated lines for 3 h prior to fixation and staining for total ubiquitin. Recruitment of ubiquitin was automatically counted using high-content imaging and analysis. (D) Recruitment of total ubiquitin (FK2), K63-linked ubiquitin, linear ubiquitin (M1), and the E3 ligase RNF213 to Toxoplasma vacuoles. HFFs were pre-stimulated with 100 U/ml IFNγ for 24 h, infected with indicated lines for 3 h prior to fixation and staining. Recruitment was automatically quantified for FK2, M1, and RNF213. K63 recruitment was manually scored, with minimum 100 vacuoles scored per condition. p-values were calculated by paired two-sided t test. *, p < 0.05; **, p < 0.01; ***, p < 0.001; ****, p < 0.0001; ns, not significant. Source data can be found in S9 Data. HFF, human foreskin fibroblast; MEF, mouse embryonic fibroblast; PVM, parasitophorous vacuole membrane.

