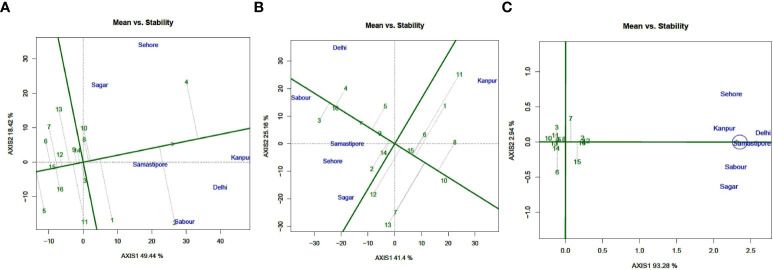
Figure 4.
ean vs. Stability view of the GGE biplot of 16 lentil genotypes across 6 testing locations. (A) Fe, (B) Zn, and (C) PA). There was no transformation of data (transform = 0), and data were centered by means of the environments (centring = 2). The biplot was based on “row metric preserving.” Numbers correspond to genotypes as listed in Table 1 .

