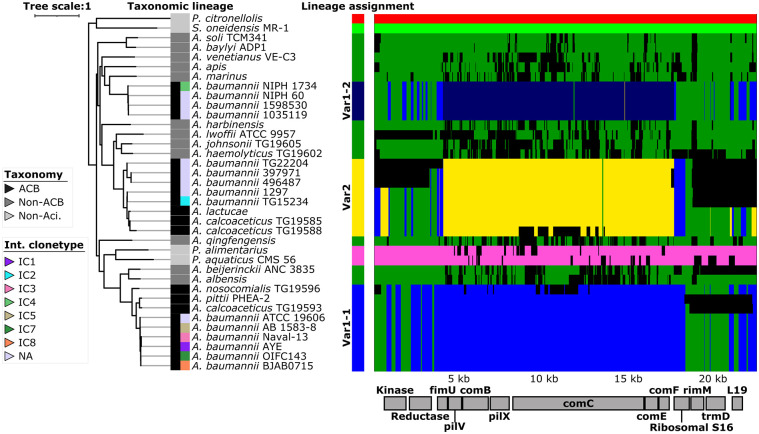
Fig 3. Patterns of ancestral recombination in the locus surrounding the comC gene.
The main plot displays the inferred patterns of ancestral recombination for Ab ATCC 19606T comC and the 12 flanking genes across 37 Acinetobacter isolates. Identity and order of the genes is indicated by the boxes below the plot. Each of the seven detected genetic lineages is represented by one color, and changes in color along the 13 genes indicate a recombination event. Alignment gaps or sites of unknown source of recombination are shown in black. The three genetic lineages represented in A. baumannii isolates are named Var1-1, Var1-2, and Var2 respectively (see main text). The maximum likelihood tree is based on the concatenated alignment of the seven T4aP proteins in this region. Branch lengths represent evolutionary time in substitutions per site. The taxonomic assignments together with the international clonetype (ICs) assignments for the A. baumannii isolates [86] are indicated by the colored boxes left of the taxon labels. Multilocus sequence typing of the A. baumannii isolates according to the Pasteur scheme is provided in S3 Table and S7 Fig. P. citronellolis–Pseudomonas citronellolis; P. alimentarius–Psychrobacter alimentarius; P. aquaticus–Psychrobacter aquaticus; S. oneidensis–Shewanella oneidensis.

