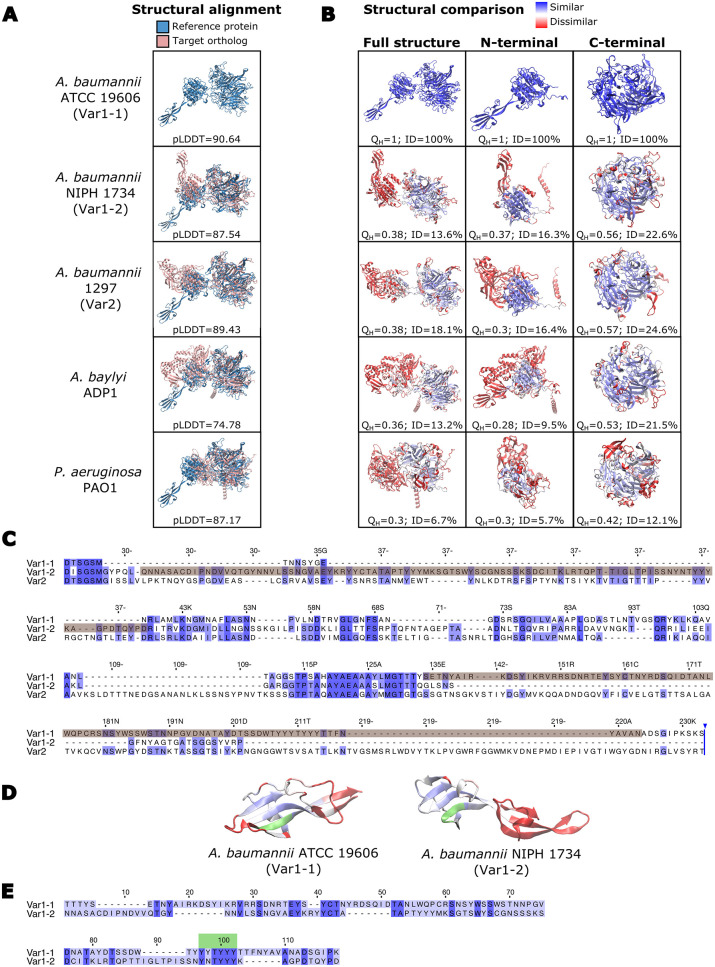
Fig 4. Structural and sequence variation of ComC.
(A) Alignments of the modelled 3D structures for Ab ATCC 19606 T ComC (blue) and the ComC of other bacterial isolates (red). The per-residue confidence for each modelled structure is given as the pLDDT value below the structures. Values >90 indicate a high accuracy and values between 70 and 90 a good accuracy of the prediction [114]. (B) Extent of structural conservation between ComC proteins shown in (A) and the reference protein in Ab ATCC 19606 T. The structure of the target protein is colored with a gradient from blue (high conservation) to red (low conservation). QH: pair-wise structural conservation score ranging from 1 (structurally identical) to 0 (no similarity). ID: percent of sequence identity in the structural alignment. (C) Multiple sequence alignment of the N-terminal part of representatives for the three ComC variants in A. baumannii. The alignment covers the amino acids 24–233 of Ab ATCC 19606 T ComC. The sequences forming the finger-like protrusions in ComCVar1-1 and ComCVar1-2 are shaded in brown. The sequences for the three variants represent the corresponding species shown in (A). (D) Structural similarity between the finger-like protrusions of ComCVar1-1 and ComCVar1-2. The color gradient from blue to red indicates decreasing similarity. The tyrosine-rich motif is highlighted in green. (E) Pair-wise sequence alignment between the sequences forming the finger-like protrusion in ComCVar1-1 and ComCVar1-2. Conserved residues are indicated in dark blue; the tyrosine-rich motif is shown in green.

