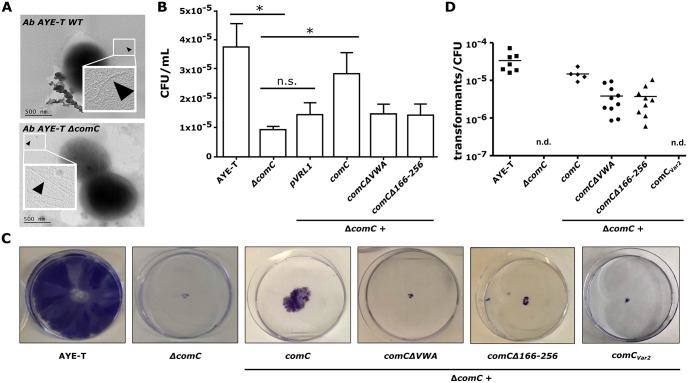
Fig 5. Functional characterization of ComC in A. baumannii AYE-T.
(A) Representative electron micrograph of wild-type A. baumannii AYE-T cells (top) and of the ΔcomC mutant (bottom). No piliation defect is seen for the mutant. A phenotyping of wild-type A. baumannii AYE-T, of the ΔcomC mutant, and of the mutant complemented with the indicated constructs are shown in the following panels. (B) Adhesion to HUVEC cells. The bar height and error bar indicate the mean number and standard deviation, respectively, of colony forming units (CFU) per mL (n = 4; values are given as S2 Table). ‘*’ indicates a significant difference (one tailed t test: p<0.05). Complementation with the truncated comC mutants did not significantly increase adhesion rates. (C) Twitching motility. Cells were stained with 1% [w/v] crystal violet. (D) Natural transformation rates of the indicated A. baumannii cells were assessed using genomic DNA of rifampicin resistant A. baumannii ATCC 19606 T. n.d.—not detected.

