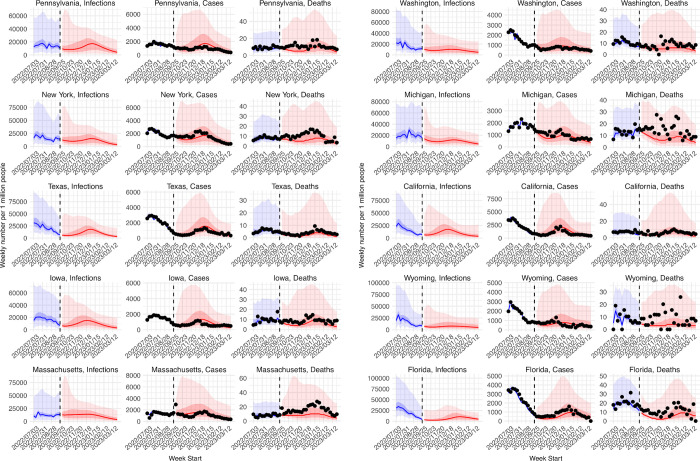
Fig 8. Real-time forecasts for the 2022–2023 respiratory virus season.
The states are arranged based on accuracy of historical forecast (higher accuracy for those in the left panel and those on the top). In each panel, each row shows estimates and forecasts of weekly numbers of infections (1st column), cases (2nd column), or deaths (3rd column) for each state. Vertical dashed lines indicate the week of forecast initiation (i.e., October 2, 2022). Dots show reported weekly cases or deaths, including for the forecast period. Blue lines and blue areas (line = median; darker blue = 50% CI; lighter blue = 95% CI) show model training estimates. Red lines and red areas (line = median; dark red = 50% Predictive Interval; lighter red = 95% Predictive Interval) show model forecasts using the best-performing approach.

