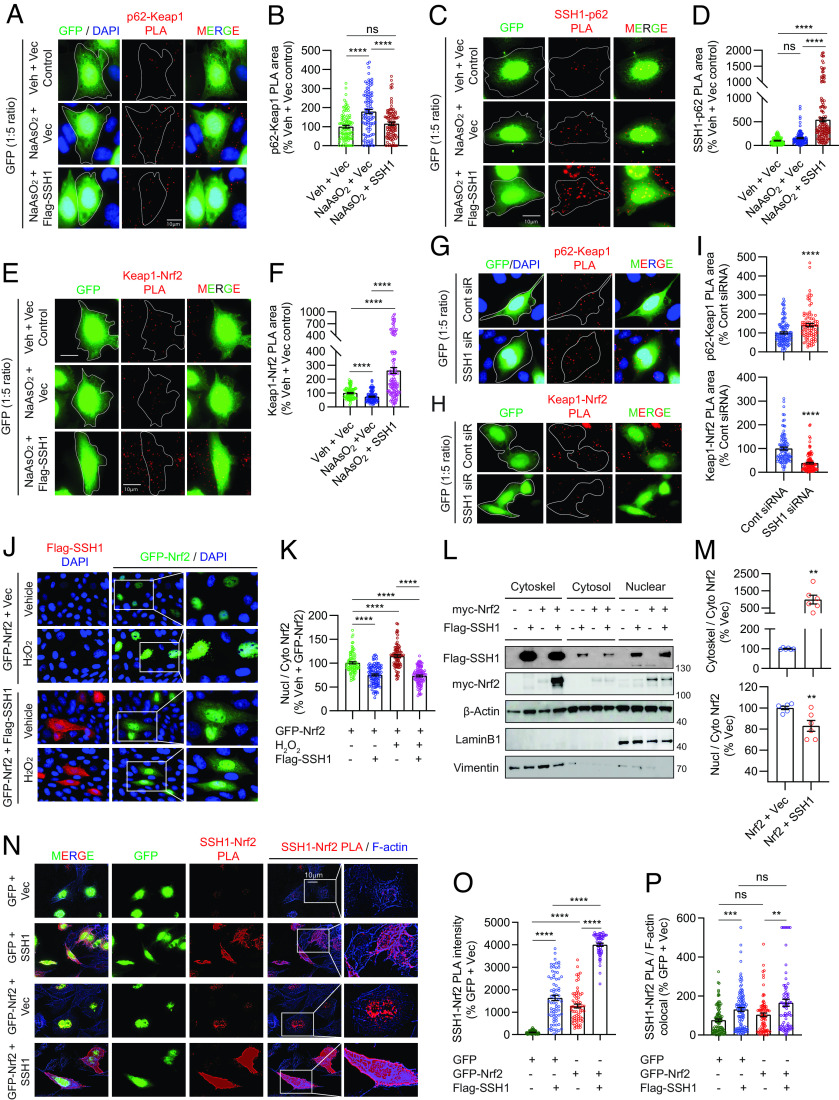
Fig. 2.
SSH1 augments Keap1-mediated Nrf2 inhibitory control under oxidative stress and sequesters Nrf2 on actin filaments. (A) Representative images of HT22 cells transfected with GFP (green) and vector or Flag-SSH1, treated ± 8 µM NaAsO2 (14 h), and subjected to PLA for endogenous Keap1–p62 (red). (B) Quantification of Keap1–p62 PLA puncta area/cell [one-way ANOVA, F (2, 296) = 21.7, P < 0.0001, post hoc Dunnett, ****P < 0.0001, ns = not significant, n = 10 to 15 images/condition/experiment from four experiments]. (C) Representative images of HT22 cells transfected with GFP (green) and vector or Flag-SSH1, treated ± 8 µM NaAsO2 (14 h), and subjected to PLA for SSH1–p62 (red). (D) Quantification of SSH1–p62 PLA puncta area/cell [one-way ANOVA, F (2, 341) = 76.79, P < 0.0001, post hoc Dunnett, ****P < 0.0001, ns=not significant, n = 8 to 10 images/condition/experiment from four experiments]. (E) Representative images of HT22 cells transfected with GFP (green) and vector or Flag-SSH1, treated ± 8 µM NaAsO2 (14 h), and subjected to PLA for endogenous Keap1–Nrf2 (red). (F) Quantification of Keap1–Nrf2 PLA puncta area/cell [one-way ANOVA, F (2, 307) = 59.38, P < 0.0001, post hoc Dunnett, ****P < 0.0001, n = 10 to 15 images/condition/experiment from four experiments]. (G and H) Representative images of HT22 cells transfected with GFP (green) and control or SSH1 siRNA and subjected to PLA for endogenous p62–Keap1 (G, red) or Keap1–Nrf2 (H, red). (I) Quantification of p62–Keap1 and Keap1–Nrf2 PLA puncta area/cell (two-tailed t test; p62–Keap1 PLA: t = 4.0812, df = 204; Keap1–Nrf2 PLA: t = 8.855, df = 208; ****P < 0.0001, n = 8 to 10 images/condition/experiment from four experiments). (J) Representative images of HT22 cells coexpressing GFP-Nrf2 (green) and vector or Flag-SSH1 (red) and treated with ± 300 µM H2O2 (3 h). (K) Quantification of nuclear/cytoplasmic Nrf2 [one-way ANOVA, F (3, 366) = 84.88, P < 0.0001, post hoc Dunnett, ****P < 0.0001, n = 10 to 15 images/condition/experiment from four experiments]. (L) Representative immunoblots from HEK293T coexpressing myc-Nrf2 and vector or Flag-SSH1, subjected to cell fractionation for cytosol, nucleus, and cytoskeleton. (M) Quantification of cytoskeletal/cytosolic and nuclear/cytosolic Nrf2, (two-tailed t test; cytoskel/cyto: t = 3.474, df = 10; nucl/cyto: t = 3.19, df = 10; **P < 0.01, n = 6 samples/condition). (N) Representative images of HT22 cells transfected with GFP or GFP-Nrf2 (green) and vector or Flag-SSH1, subjected to PLA for SSH1–Nrf2 (red) and F-actin phalloidin staining (blue). (O) Quantification of SSH1–Nrf2 PLA puncta intensity/cell [one-way ANOVA, F (3, 255) = 306.3, P < 0.0001, post hoc Dunnett, ****P < 0.0001, n = 10 to 15 images/condition/experiment from four experiments]. (P) Quantification of SSH1–Nrf2 PLA colocalized with F-actin [G: one-way ANOVA, F (3, 372) = 11.70, P < 0.0001, post hoc Dunnett, ***P < 0.001, **P < 0.01, ns = not significant; n = 10 to 15 images/condition/experiment from four experiments].

