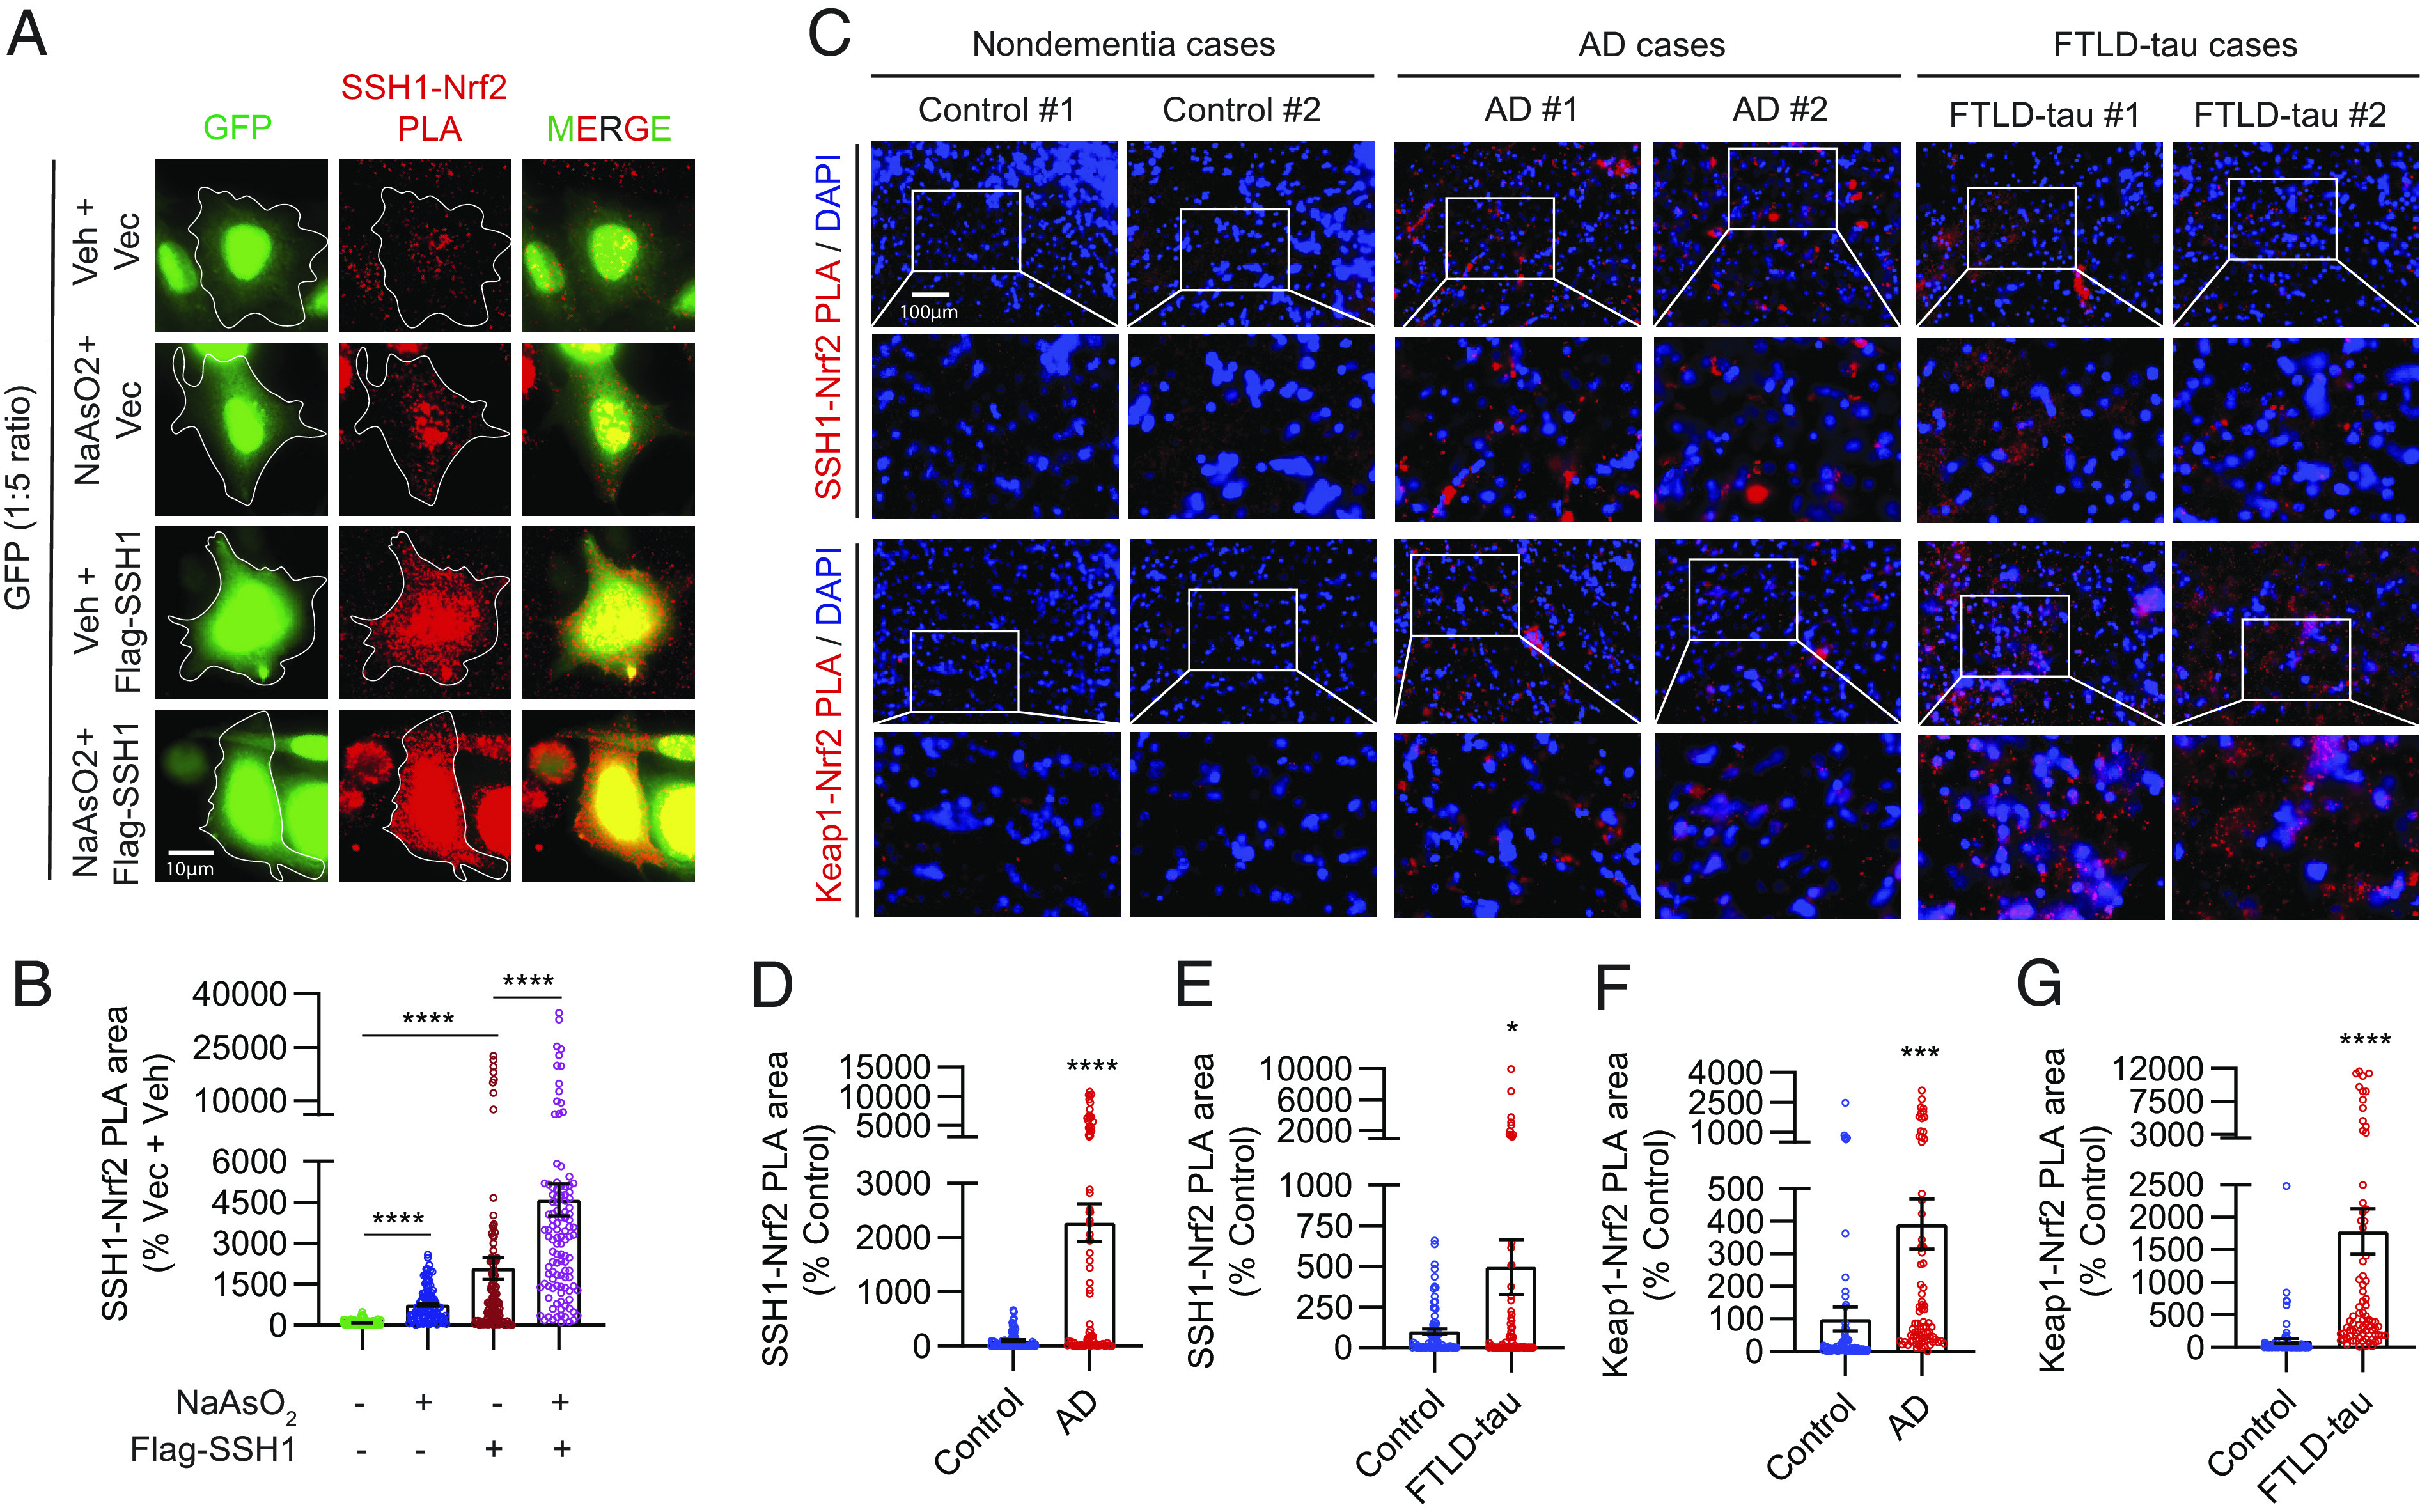
Fig. 3.

AD and FTLD-tau brains exhibit excessive levels of inhibitory SSH1–Nrf2 and Keap1–Nrf2 interactions. (A) Representative images of HT22 cells transfected with GFP (green) and vector or Flag-SSH1, treated ± 8 µM NaAsO2 (14 h) and subjected to PLA for SSH1–Nrf2 (red). (B) Quantification of SSH1–Nrf2 PLA puncta area/cell [Brown-Forsythe and Welch ANOVA, F (3, 202.7) = 30.48, F (3, 183.2) = 62.13, P < 0.0001, post hoc Dunnett, ****P < 0.0001, n = 10 to 15 images/condition/experiment from four experiments]. (C) Representative images of human frontal gyrus sections from nondementia, AD, and FTLD-tau cases showing DAPI (blue) and PLA for SSH1–Nrf2 (red) and Keap1–Nrf2 (red). (D and E) Quantification of SSH1–Nrf2 PLA area in (D) control vs. AD (two-tailed t test, t = 6.329, df = 156, ****P < 0.0001, n = 8 to 10 images/case from 7 to 8 case/condition) and (E) control vs. FTLD-tau (two-tailed t test, t = 2.353, df = 157, *P = 0.0199, n = 8 to 10 images/case from eight cases/condition). (F and G) Quantification of Keap1–Nrf2 PLA area in (F) control vs. AD (two-tailed t test, t = 3.371, df = 154, ***P = 0.0009; n = 8 to 10 images/case from 7 to 8 cases/condition) and (G) control vs. FTLD-tau (two-tailed t test, t = 4.752, df = 152; ****P < 0.0001; n = 8 to 10 images/case from eight cases/condition).
