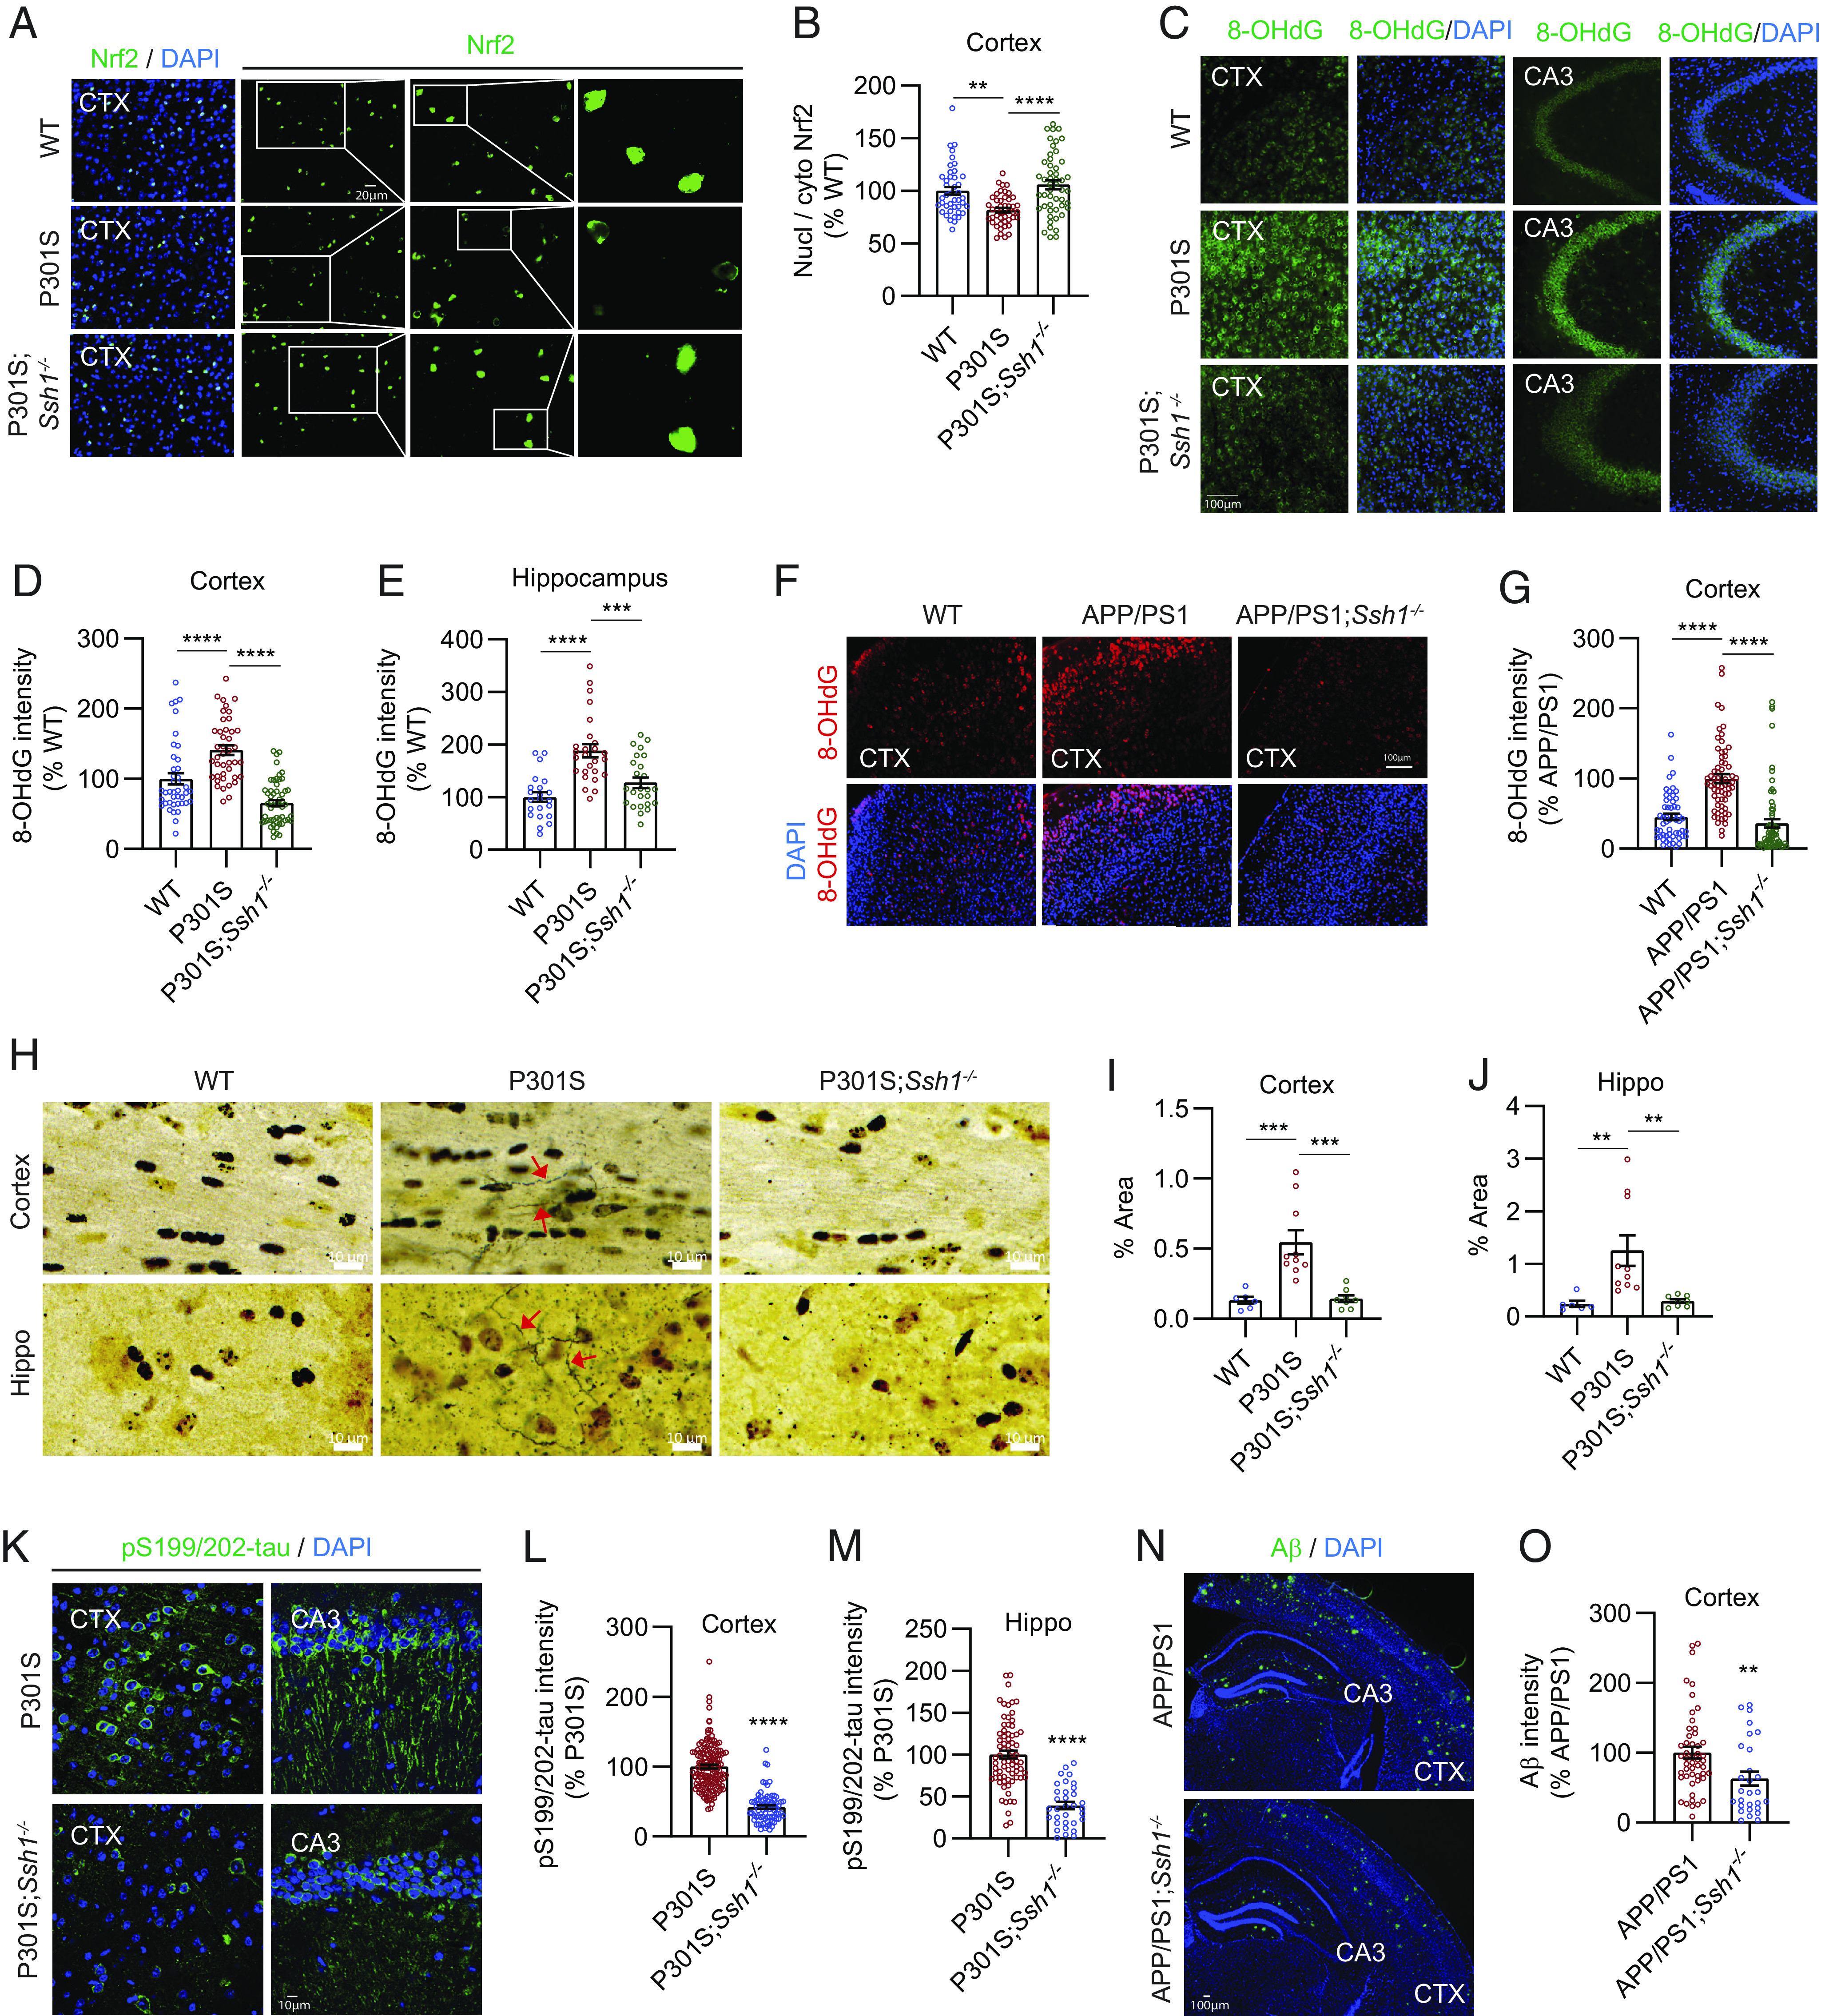
Fig. 4.

Ssh1 elimination increases nuclear Nrf2, reduces oxidative injury, and alleviates AD pathology. (A) Representative images of the cortex from 7-mo-old WT, P301S, and P301S;Ssh1−/− mice stained for Nrf2 (green) and DAPI (blue). White boxes serially magnified to the right. (B) Quantification of nuclear/cytoplasmic Nrf2 intensity [one-way ANOVA, F (2, 134) = 13.06, P < 0.0001, post hoc Dunnett, ****P < 0.0001, **P = 0.0013, n = 10 to 12 images/mouse from four mice/genotype]. (C) Representative images of the cortex and hippocampus (CA3) stained for 8-OHdG (green) and DAPI (blue) from 7-mo-old WT, P301S, and P301S;Ssh1−/− mice. (D and E) Quantification of 8-OHdG intensity in the (D) cortex [one-way ANOVA, F (2, 134) = 37.79, P < 0.0001, post hoc Dunnett, ****P < 0.0001, n = 10 to 13 images/mouse from four mice/genotype) and (E) hippocampus [one-way ANOVA, F (2, 70) = 17.85, P < 0.0001, post hoc Dunnett, ****P < 0.0001, ***P = 0.0003, n = 5 to 7 images/mouse from four mice/genotype]. (F) Representative images of the cortex from 8-mo-old WT, APP/PS1, and APP/PS1;Ssh1−/− mice stained for 8-OHdG (red) and DAPI (blue). (G) Quantification of 8-OHdG intensity [one-way ANOVA, F (2, 181) = 36.83, P < 0.0001, post hoc Dunnett, ****P < 0.0001, n = 10 to 12 images/mouse from four mice/genotype]. (H) Representative images of silver staining of the cortex and hippocampus from 7-mo-old WT, P301S, and P301S;Ssh1−/− mice. Red arrows indicate silver-positive degenerating axons. (I and J) Quantification of silver-positive axons in the (I) cortex [one-way ANOVA, F (2, 21) = 14.5, P = 0.0001, post hoc Dunnett, ***P < 0.0005, n = 6 to 10 mice/genotype] and (J) hippocampus [one-way ANOVA, F (2, 21) = 7.545, P = 0.0034, post hoc Dunnett, **P < 0.0081, n = 6 to 10 mice/genotype]. (K) Representative images of the cortex and hippocampus (CA3) stained for pS199/202-tau (green) and DAPI (blue) from 7-mo-old P301S and P301S;Ssh1−/− mice. (L and M) Quantification of pS199/202-tau intensity in the (L) cortex (two-tailed t test, t = 13.85, df = 221, ****P < 0.0001, n = 20 to 30 images/mouse from four mice/genotype) and (M) hippocampus (two-tailed t–test, t = 8.147, df = 104, ****P < 0.0001, n = 13 to 18 images/mouse from four mice/genotype). (N) Representative images of the cortex and hippocampus stained for Aβ (green) and DAPI (blue) from 8-mo-old WT, APP/PS1, and APP/PS1;Ssh1−/− mice. (O) Quantification of Aβ intensity in the cortex (two-tailed t test, t = 2.784, df = 76, **P = 0.0068, n = 6 to 8 images/mouse from 4 to 6 mice/genotype).
